


The bounce - how far, how long?
Week beginning August 15, 2011
I will deal with the potential of "the bounce" in a few moments - including the all-important questions of how far it might go and how long it's likely to last.


Last weekend we went through a series of charts - technical and planetary - indicating Price had reached a level which ought to have provided some level of Support. In panic/crash mode, those levels did not hold and were broken.
Safe trading - RA
(Disclaimer: This article is not advice or a recommendation to trade stocks; it is merely educational material.)
However, that wasn't entirely unexpected - and we will see shortly that those levels have now been recovered. We will return firstly to one of the charts I used last week.
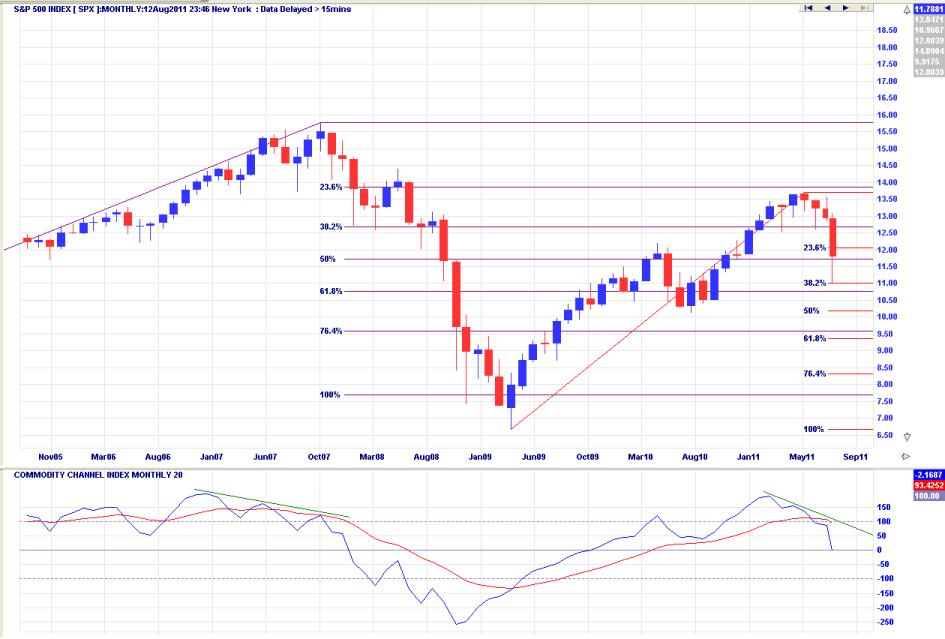
And I'd like to go back over some of what I said last week when I used this long-term monthly chart of the SP500.
"... these tragicomedies tend to follow a very old script. In the chart above are two sets of Fibonacci retracements ... the darker one for the 2002-2007 Bull and the red one for the Bull recovery run from early 2009.
The first leg of ANY Bear phase tends to stop at the 236 or 382 level and spend some time bouncing around there. Remember one of the lessons from the final chapter of the book - a large amount of Price in a small amount of Time needs to be followed by a large amount of Time for a small amount of Price.
I seriously doubt this particular downtrend is over. But, I'm also not going to bet the farm that a full-blown crash is taking us to Hades in one fast, unbroken movement.
Very soon now, I'd expect a 2nd degree countertrend, followed by a retest of the Low, followed by a countertrend of some cyclical degree."
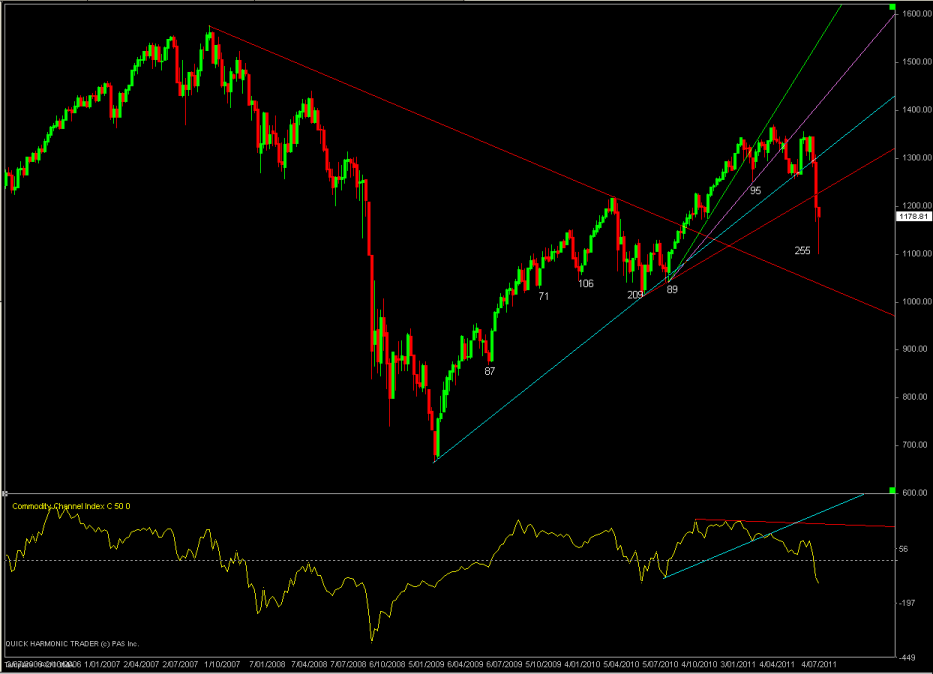
Okay. Back to the present - and we see the bounceback did, indeed, start at virtually the precise level of the 382 retracement. I'd like to stress this point because time-and-again I see experienced traders scrambling all over the place trying to find "meaning" in what is happening, becoming unnecessarily frustrated, panicked, or coerced by the multitude of opinions.
Now, forget the "news". Historically, over many Bull and Bear markets over many, many decades, we see the same lines, the same cliches, the same crap, quite frankly. And we also see the same patterns.
Look back at the first leg down from the 2007 High and what happened ... which was a spike Low, followed by a small recovery (of 2nd degree), followed by a retest of that Low, followed by a cyclical rise (well, it was cyclical in terms of the daily bar count).
So far, this new Bearish phase - and that is what we have been expecting and what is most likely at this time - is doing exactly what that "very old script" calls for.
Let's have a quick look at a couple of the other monthly charts from last weekend - the long-range Old Gods and my Mars Bars charts.
"... these tragicomedies tend to follow a very old script. In the chart above are two sets of Fibonacci retracements ... the darker one for the 2002-2007 Bull and the red one for the Bull recovery run from early 2009.
The first leg of ANY Bear phase tends to stop at the 236 or 382 level and spend some time bouncing around there. Remember one of the lessons from the final chapter of the book - a large amount of Price in a small amount of Time needs to be followed by a large amount of Time for a small amount of Price.
I seriously doubt this particular downtrend is over. But, I'm also not going to bet the farm that a full-blown crash is taking us to Hades in one fast, unbroken movement.
Very soon now, I'd expect a 2nd degree countertrend, followed by a retest of the Low, followed by a countertrend of some cyclical degree."
Okay. Back to the present - and we see the bounceback did, indeed, start at virtually the precise level of the 382 retracement. I'd like to stress this point because time-and-again I see experienced traders scrambling all over the place trying to find "meaning" in what is happening, becoming unnecessarily frustrated, panicked, or coerced by the multitude of opinions.
Now, forget the "news". Historically, over many Bull and Bear markets over many, many decades, we see the same lines, the same cliches, the same crap, quite frankly. And we also see the same patterns.
Look back at the first leg down from the 2007 High and what happened ... which was a spike Low, followed by a small recovery (of 2nd degree), followed by a retest of that Low, followed by a cyclical rise (well, it was cyclical in terms of the daily bar count).
So far, this new Bearish phase - and that is what we have been expecting and what is most likely at this time - is doing exactly what that "very old script" calls for.
Let's have a quick look at a couple of the other monthly charts from last weekend - the long-range Old Gods and my Mars Bars charts.
Copyright: Randall Ashbourne - 2011
Secondly, and more importantly, my apologies to existing readers. Things got a little hectic during the week and I've not finished researching previous Bear markets to the extent needed to publish an article on what is likely to happen into October/November of 2012.
I know some of you popped back to check during the week. Your patience is appreciated and I'll get it online as soon as possible.
Now, a couple of weekends ago, I mentioned some spooky stuff - specifically the potential for a Mars/Uranus crash cycle, the potential for a sudden move as Mercury went Retrograde and, also, the possibility that there'd be a turnaround halfway through the Merc Rx cycle running August 3 to 27.
We appear to have had a crash cycle INTO the Mars/Uranus date, rather than starting at the aspect date. This is one of the major problems of using astrology alone and why The Idiot & The Moon concentrates on using technical systems.
Astrology can tell us the dates when significant turns are likely, but predicting direction is almost impossible without learning the technical side of things.
And it's to that we'll now turn our attention.
But first, a warm welcome to new readers - along with the advice to take it s-l-o-w-l-y. Enthusiasm is not a valid substitute for competence, which takes a little time to acquire - but your bank balance will like it.
Now, let me deal for a moment with applying these techniques in the real world in real time.
One might think that the 1165/1178 levels were a not unreasonable place to initiate a new Long position, in anticipation of a continuing bounce.
Indeed, it was NOT unreasonable ... SO LONG AS YOU HAD BLOODY TIGHT LOSS STOPS IN PLACE!
You know the first rule! ALWAYS protect your capital ... especially when all three Idiots have moved to a Sell signal!
What made a Long quite iffy at those Price levels was:
1. We were in the 1Q-Full Moon phase, which is very dangerous for Long positions in a confirmed Bear phase as determined by the state of The Idiot.
2. There was NO positive divergence reading from the fast MACD and nowhere did I give an indication that The Canaries were starting to sing a different tune.
Okay. So, we are now in the position with Wall Street where Chicken Little has been running around with his head cut off for a couple of weeks ... into the date of a Mars/Uranus crash aspect, a Full Moon, and the approximately halfway measure of the Mercury Rx period.
I'll return to les Spookies in a moment, but first I'm going to put up another couple of charts. If you're doing a copy-and-paste on this article for printing and reading at leisure, you will probably want to avoid printing the next two charts so you don't run out of black ink.
Yes, I know. You'd prefer I only publish white charts. Get over it.
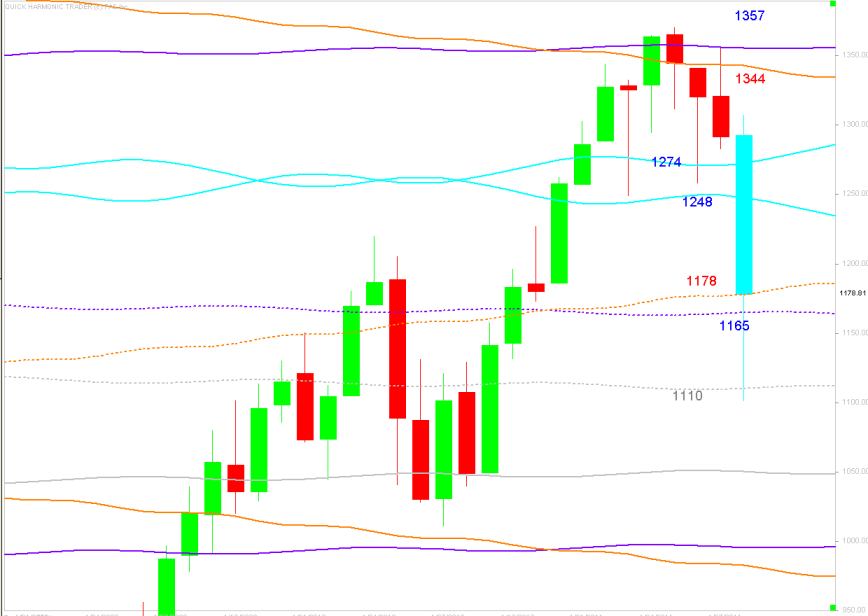
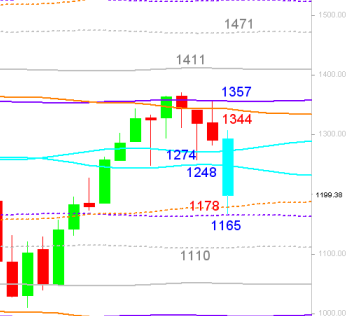
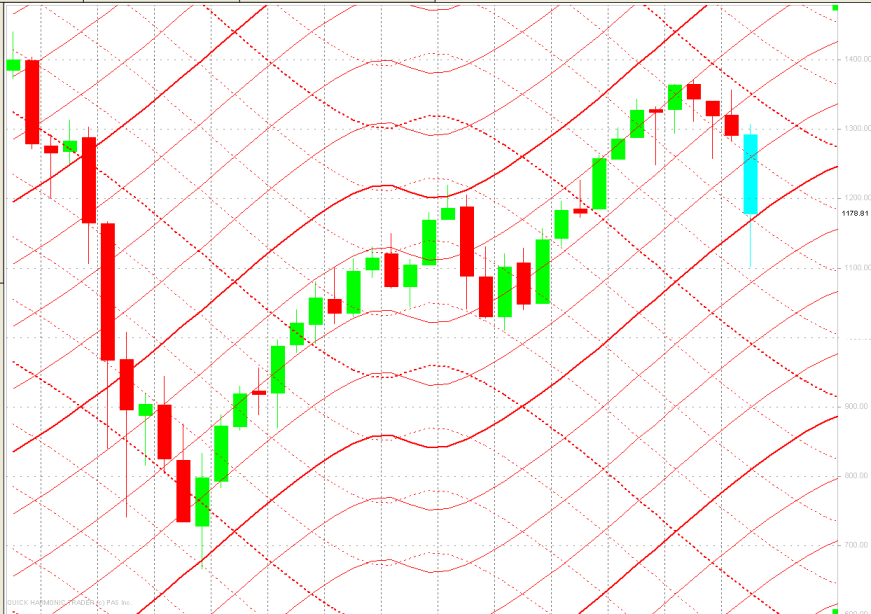
The current state of the chart is above and the position last weekend is on the left.
We had the potential for finding Support at last week's 1165 and 1178 levels, but as I'd indicated in the text with the Fibonacci chart: "I seriously doubt this particular downtrend is over."
And that turned out to be the case.
We had the potential for finding Support at last week's 1165 and 1178 levels, but as I'd indicated in the text with the Fibonacci chart: "I seriously doubt this particular downtrend is over."
And that turned out to be the case.
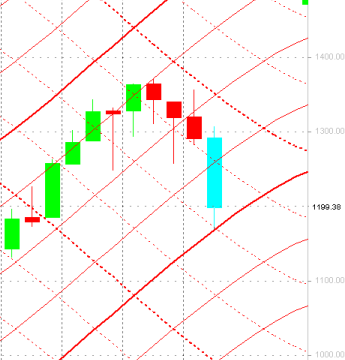
The Mars Bars chart last weekend (right) showed similar potential for a bounce, having perked up after an exact touch of a first harmonic channel line rising from the exact level of the 2009 Bear bottom.
In the current chart (below), we can see the SP500 has recovered that primary Martian spaceship trajectory.
Both Old Gods and Mars Bars are showing what MIGHT be what is called "a false break" pattern ... that is, Price has broken barriers that ought not to have been breached so summarily.
However, keep the Fibonacci historical pattern in mind!
This is a weekly bar chart and the omens, portents and entrails aren't something you'd want to put into a revitalising soup recipe.
This is a nasty, nasty Price plunge - unlike anything other than the worst slide of the previous 2007-2009 Bear market - and the long-range Canary is off the perch and squawking feebly on the coal mine floor.
Make note of the declining red diagonal linking the 2007 and 2010 high prices. Because the ASX 200 shows what just might be coming up for Pollyanna in Chicken Little mode.
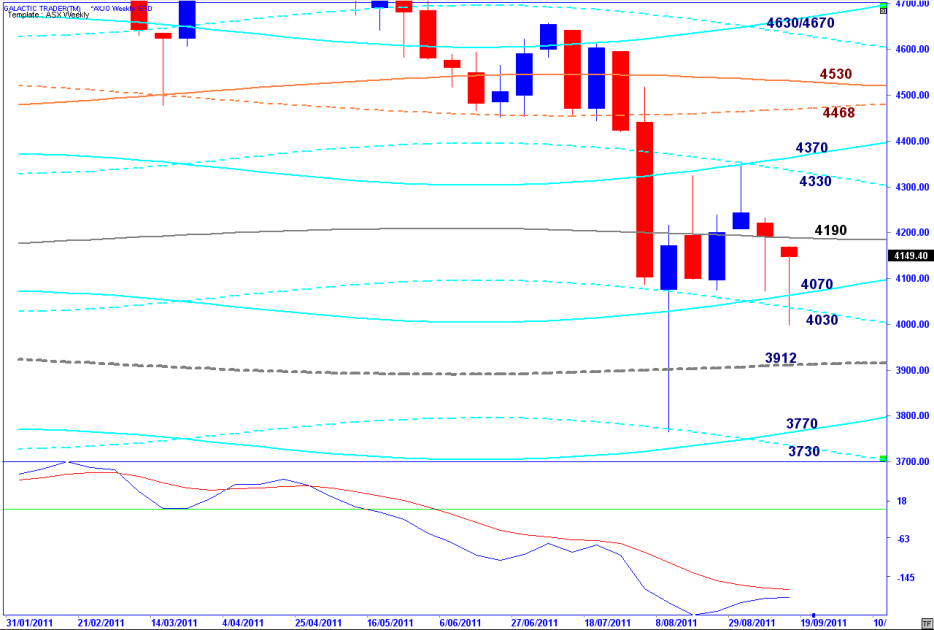
I can't actually find a previous occasion on the ASX when the long-range Canary has plunged this deeply! Anyway, the break and recovery of the long-range downtrend angle certainly suggests there should be a cyclical-length countertrend higher developing in the very near future.
In fact, the only thing which really argues against it is the seasonal tendencies of the American stock market. The worst-performing month, overall, is actually September.
Now, back to the question of "the bounceback" and how long and how far? The last part of the question is probably the easiest to answer. When the illustrious and hard-working doyens - *cough*splutter*gag*retch* - at Goldmans and Morgans decided to take the trillions of dollars of Treasury money deposited in the US Federal Reserve (which they own and control) and use it, with the Chairman's blessing, to prop up the economy (Goldmans and Morgans) with high-speed trading computers conveniently approved by the NYSE to sit next to its own computers to make it all even faster, they had to give some instructions to the geeks who program the systems. Fibonacci.
What? You detect a hint of sarcasm?! Oh, fiddlededee! It's crooked! It's corrupt! It stinks! If it happened in Jakarta, most of those mealy-mouthed Senators and Congressmen would be crying foul ... interference with the markets ... Suharto/Sukarno commie/capitalism. Etc. No, no, no ... when Wall Street does it, it's "quantitative easing".
Anyway, the programs had to be given some set of parameters and the obvious set was Leo's beautiful set of numbers.
As to the "how long", it'll be a cyclical daily count - a minimum of 22 days, when it starts, and probably into 30, 60 or 90.
And it should start very soon. There are 2 key periods this coming week - Tuesday and Thursday/Friday. For the most part, the astrological symbolism is starting to turn positive, after the hard Mars transits to Uranus and Pluto (and the final aspect in the set, a square to Saturn, on August 25). Sun, Mercury and Venus all start making kissy-smoochies and Sun, Venus and Mars happen to be making long-distance kissy-smoochies with Jupiter, too.
Wednesday in New York could be a volatile, negative period. The Moon, in aggressive Aries, will set off the hard Martian crash aspects.
Okay, that's enough for this weekend. Do be careful! Despite all the dire news, the old scripts should play out. But if you are going to try to play the historically and statistically likely scenarios, do remember to use loss stops and keep them very tight. In the long run, keeping your trading capital intact and making the SAFE profitable moves are much more important than being in the market while the Chicken is going ga-ga.