
More target levels for various indices
Week beginning August 11, 2013
While it is slow getting started, the odds still lean towards most major world indices now entering another significant correction.

Copyright: Randall Ashbourne - 2011-2013
In the broader Asian region, New Zealand, Malaysia and Indonesia are still close to all-time highs, while India, Singapore and Hong Kong are struggling to recapture peaks from earlier in the year.
We will review some further long-range and intermediate charts for a range of indices this weekend - including the SP500, the FTSE, the DAX, France and the Netherlands, India, Singapore, Hong Kong and Australia. I'll add some others in the next few weeks.
Astrologically, we're within the period I went into some detail about last weekend - where Jupiter is starting a series of oppositions to Pluto and squares to Uranus; two signatures associated with long-range peaks in the Wall Street indices.
It is difficult to generalise because not all markets are moving in the same direction.
In Europe, for example, England and Germany have failed to take out their May highs, but France and Holland have exceeded those levels with some technical indications they can go still higher.
In Europe, for example, England and Germany have failed to take out their May highs, but France and Holland have exceeded those levels with some technical indications they can go still higher.


Safe trading - RA
(Disclaimer: This article is not advice or a recommendation to trade stocks; it is merely educational material.)
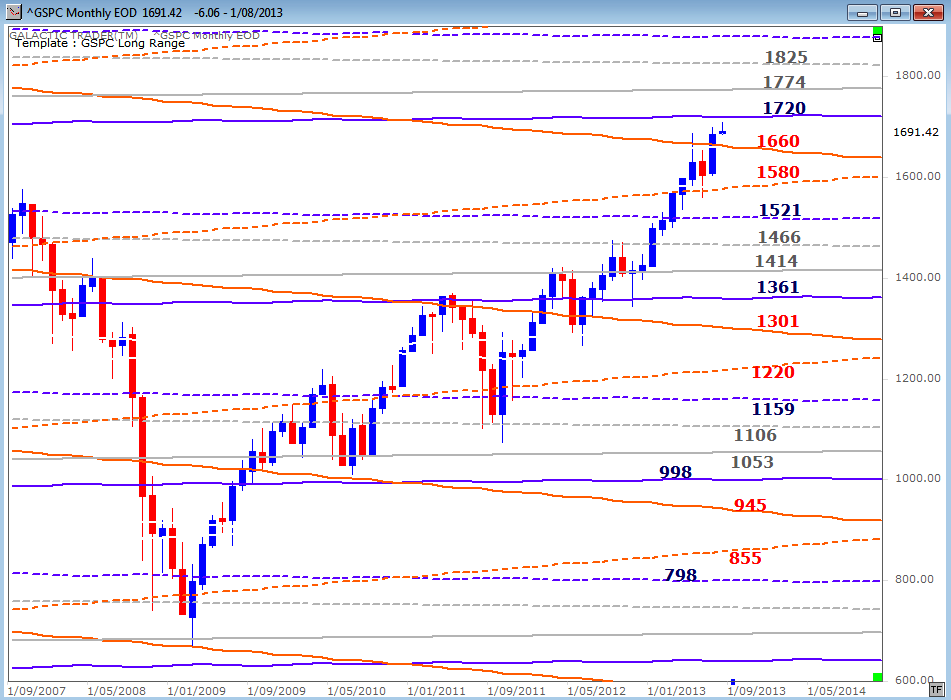
We'll begin this weekend with the long-range planetary price chart for Pollyanna, the SP500. I've been warning for the past few weekends that technical conditions on the daily and weekly charts were deteriorating badly and in the July 29 edition I published a chart showing there was probably very little upside left for the bounceback which began in June.
At least so far, Pollyanna has been unable to reach that target - around the 1720 level.
At least so far, Pollyanna has been unable to reach that target - around the 1720 level.
Forecast 2013 is now available for sale and download.
Click the button on the right for more details.
Click the button on the right for more details.


Forecast 2013 is now available for sale and download.
And since half the year is gone ... it's now half price!
And since half the year is gone ... it's now half price!
We can't be absolutely certain that a major correction is now underway. But the odds are likely that is the case.
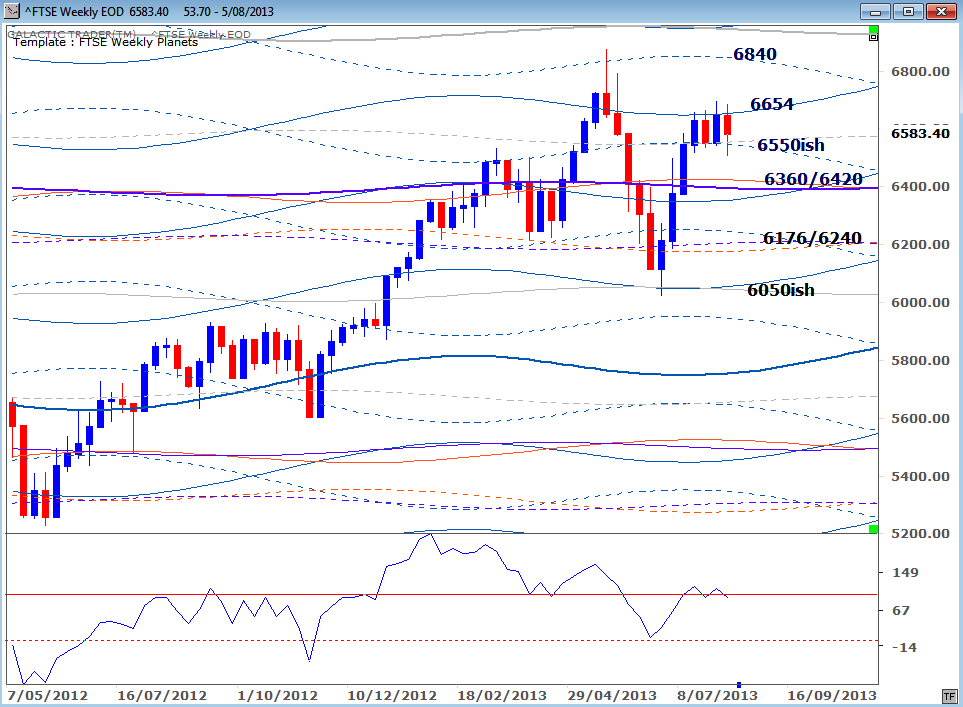
While American markets have taken out the May high, the FTSE has spent the past few weeks trapped between two major planetary price lines at a lower level - and the oscillator continues to be very unhappy.
While American markets have taken out the May high, the FTSE has spent the past few weeks trapped between two major planetary price lines at a lower level - and the oscillator continues to be very unhappy.
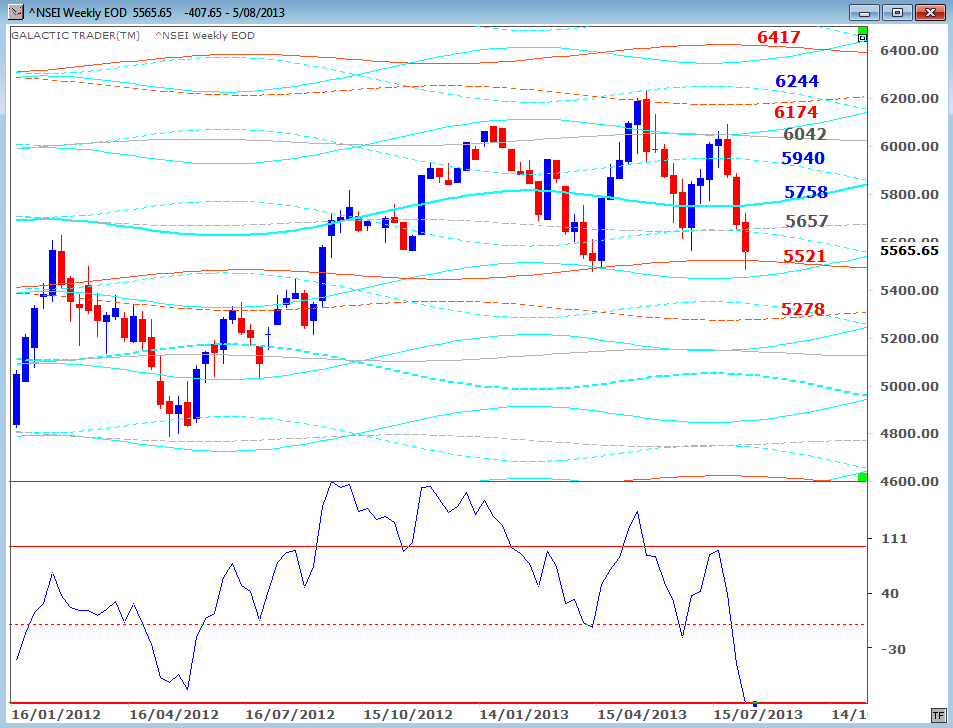
Mumbai's Nifty, however, shows signs of continuing weakness. It has retested a Uranus level in the 5520s, but one doubts it can hold ... largely because the Big Bird oscillator has plunged to new depths, even though price is at about the same level.
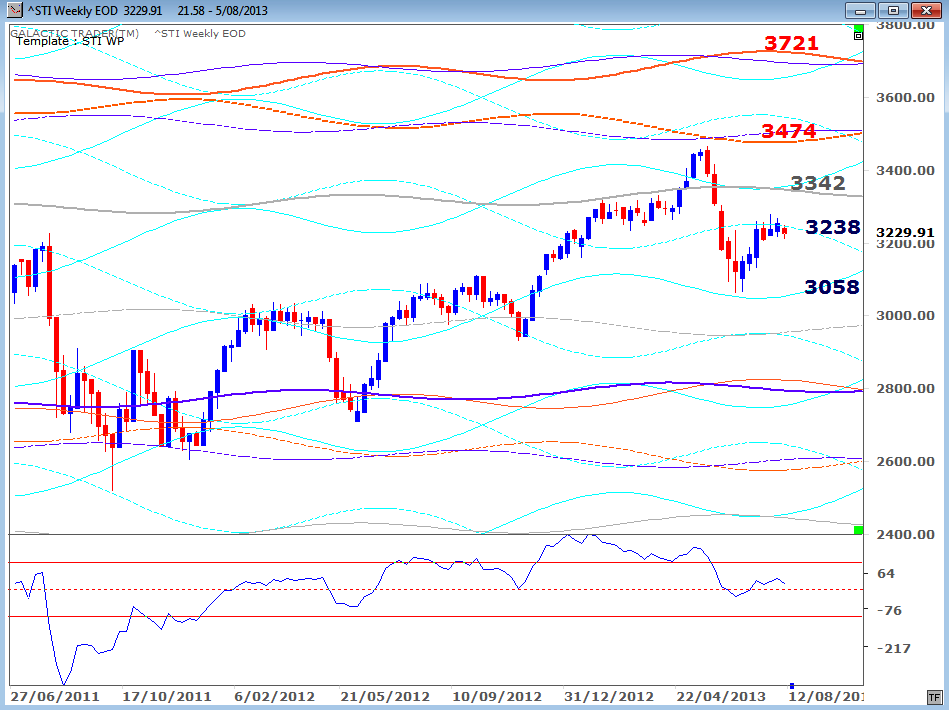
Singapore is now in its 6th week of pushing against an overhead Saturn level well below its May peak.
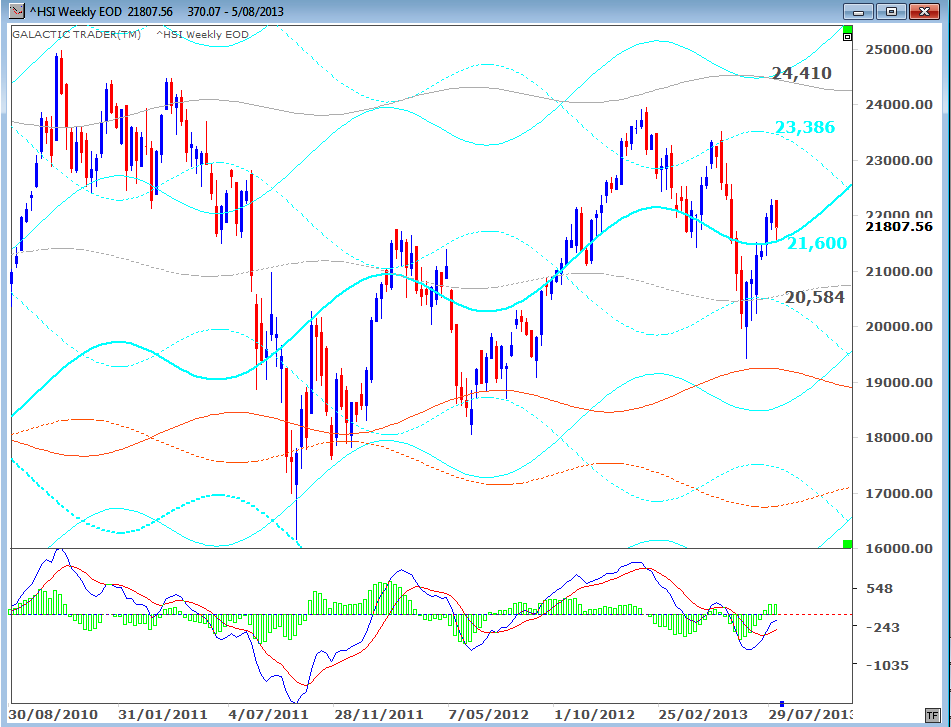
Hong Kong is having similar problems; worse to some extent because the Hang Seng peaked early in the year and is starting to make lower highs and deeper lows.
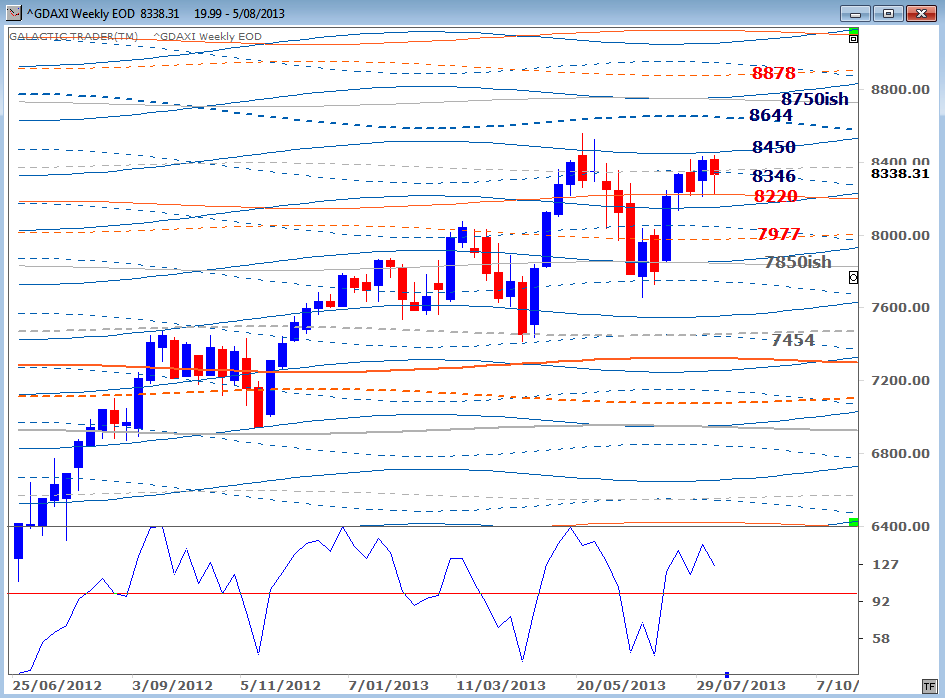
The same is largely true for Germany's DAX index (below).
The French CAC40, however, is attempting to break out higher - with no disagreement at all from the long-range oscillator.

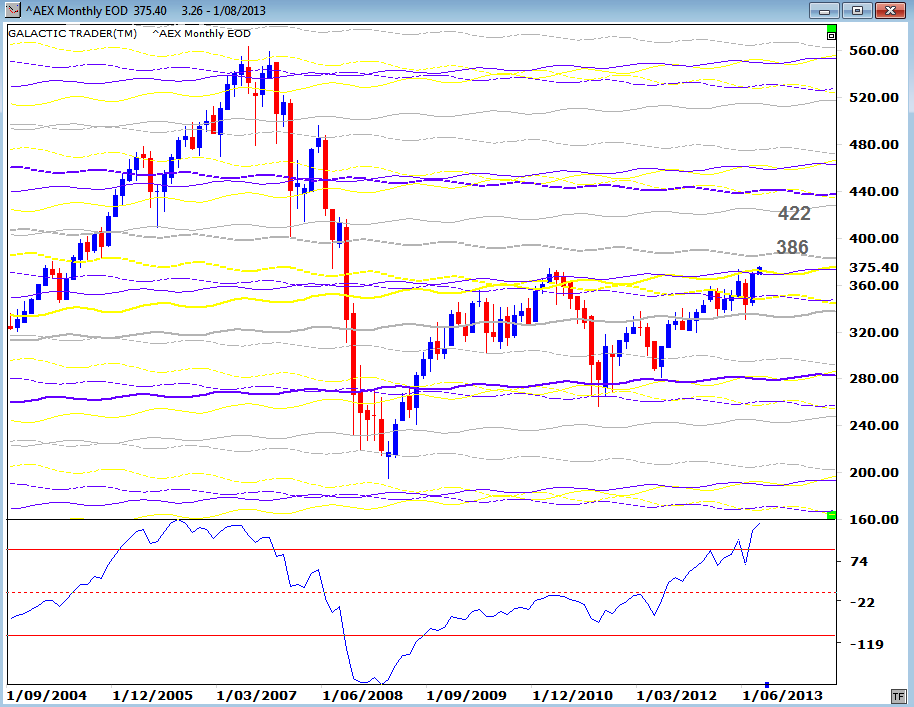
Holland's AEX is receiving even stronger signals from the oscillator.
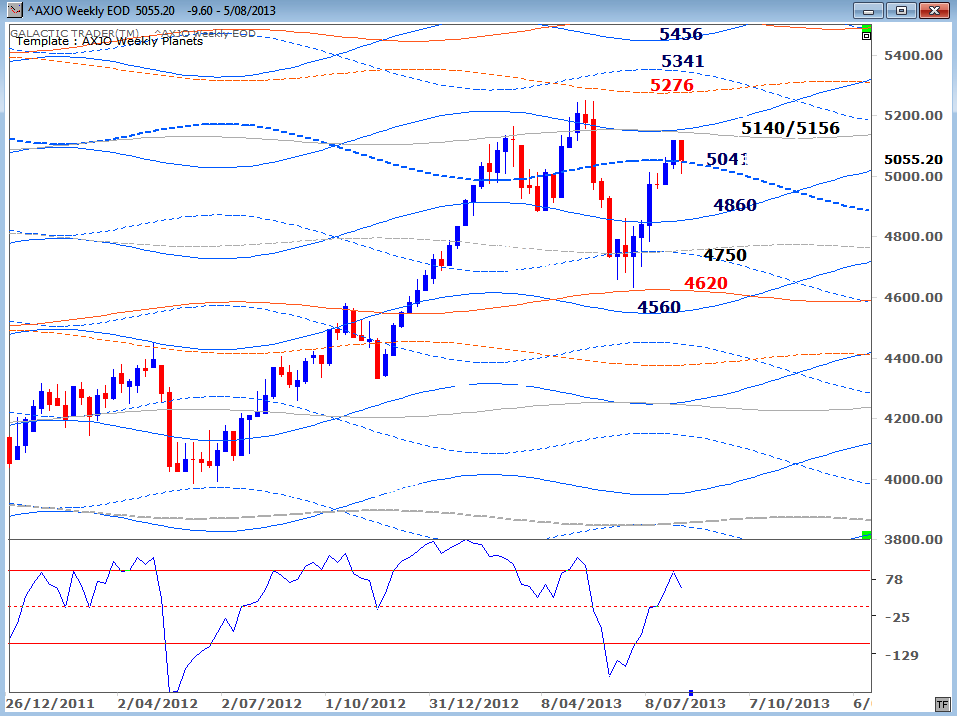
Australia, too, may be in deep trouble. It is trying desperately to hold an important Saturn level now around 5040 on the ASX Weekly Planets chart but is in dire danger of setting up a very negative Head&Shoulders pattern.
As I indicated at the beginning, it's now getting very difficult to "generalise" because of the growing disconnect between major markets.
In a healthy environment, there is a tendency for everyone to move in the same direction. There are always some exceptions, of course, because of local or regional factors which tend to be relatively short-lived. That's not really what we have here, even allowing for some regional differences and changes in currency rates.
In any case, I hope these intermediate and long-range charts help you determine probable targets - both for what I think is probably another downswing correction and, also, for potential tops to the Bull market in any bounceback out of the correction.