
Two minor turn dates ahead
Week beginning April 9, 2012
While major Western indices were closed on Friday, there was a brief period of futures trading - and Wall Street dropped sharply.

Copyright: Randall Ashbourne - 2011-2012
There are a couple of minor Bradley Model turn dates due this month - on the 11th and the 23rd. Over the next week or so, Pluto goes Retrograde, Mars turns back to Direct motion, and the Sun opposes Saturn.
I indicated last weekend we were likely to get a taste of the mood shift likely to manifest in the coming months as Uranus heads towards its first exact square to Pluto in June ... and that we were beginning to see initial signs of technical deterioration and panic brewing.
We'll explore all of that a little further in this edition. One of the reasons I constantly nag about not allowing astrological expectations to over-ride technical conditions is that we are asking a lot of the old system if we expect it to give a form guide to the markets every week of the year.
In the good old days, the King would call in his Spooky Stuff Guy and ask a simple question. When's the best time to invade Babylon? Should I marry my daughter to the Grand Duke Yuri? Simple, but specific questions. And fairly easy to answer because they were so specific.
It's rather more complex to adapt the Spooky Stuff to answer questions unerringly every day. We can expect a particular aspect to affect markets, but which ones? Transport, gold, commodities, or broad indices? And that is why we must place most reliance on the technical conditions.
What we don't know at this stage is whether the drop will translate to the real markets when trading opens for the week - or whether it was just a reaction to a bad moon rising ... the Libran Full Moon.
On Tuesday, the Moon will move into Sagittarius for a couple of days and la Lune in Sadge frequently brings about wide-range days, where either the optimism or the fear becomes exaggerated.
On Tuesday, the Moon will move into Sagittarius for a couple of days and la Lune in Sadge frequently brings about wide-range days, where either the optimism or the fear becomes exaggerated.


I thought we might begin this week with a look at another old system, albiet one not nearly so ancient or difficult as astrology. And that's The Dow Theory - the belief that neither Highs nor Lows in one index should be entirely trusted if not confirmed by a similar condition in a second index.
The theory revolves around the Dow Jones Industrials and the Dow Jones Transports. In the old days ... factories versus railroads. The reasoning behind the system is clear. The factories make stuff and the railroads move stuff. The two indices are supposed to move in tandem.
If the shops are selling lots of stuff, the factories make lots and the railroads shift a lot of stuff. But, if the price of railroad stock is high and factory prices are low, something's wrong - and vice versa.
Well, we're getting a preliminary case of vice versa.
If the shops are selling lots of stuff, the factories make lots and the railroads shift a lot of stuff. But, if the price of railroad stock is high and factory prices are low, something's wrong - and vice versa.
Well, we're getting a preliminary case of vice versa.
The chart above is the Dow Jones Transport index. And it has NOT broken the Highs of 2011. There are a few things of interest about this chart. One of them is I've applied the same Weekly Planets template used for the FTSE so we can see it's knocking its head against the same set of planetary price lines which capped the 2007 twin peaks, as well as the push into the 2011 twin peaks.
Also interesting is the DJT's history of actually making twin peaks - and the fact it might be doing that just now. And doing it with a case of negative divergence signals from the MACD histogram and signal lines.
Now, as y'know, I'm a big fan of NOT taking any notice of the news and relying almost solely on the state of the charts. But, it's worth a quick note that the main headlines for the markets this weekend are: -
* Jobs Report, Earnings Season Will Test This Market Bull
* Disappointing Jobs Report Revives Talk of Fed Easing
* Earnings Season Likely to Be a Disappointment
I said last weekend: "Astrologically, the mood is slowly changing from the incredibly positive outlook of the Venus-Jupiter conjunction in Taurus, trined to Mars and Pluto, which took place in mid-March."
And the mood shift is starting to show up in the headlines. Of course, it could be a set-up ... goading the Bears to load-up on Shorts so the computers go into gushing Pollyanna mode next week and steal their money. So, I'll remind you of something I said earlier ... the Moon in Sagittarius often provokes wide-range days which exaggerate either the optimism or the fear.
Anyway, the DJT is not, at this stage, confirming the new Highs in the DJI as being legitimate ... and we're starting to see public signs of the mood shift we've been expecting to occur since the Venus-Jupiter conjunction a few weeks ago.
So, let's go to the charts.
Safe trading - RA
(Disclaimer: This article is not advice or a recommendation to trade stocks; it is merely educational material.)
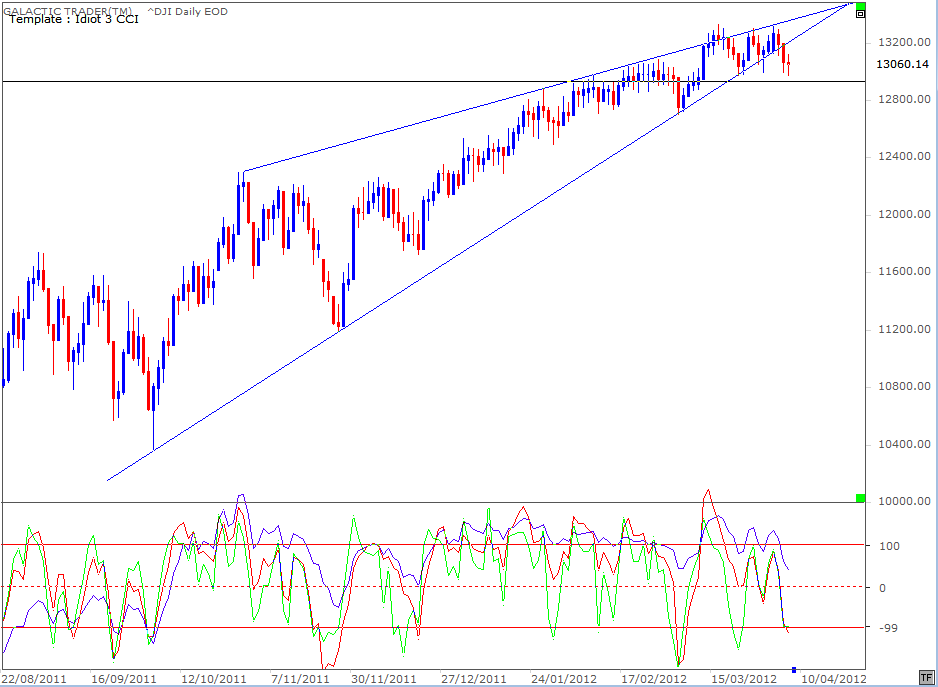
First up is the DJI which has now broken its uptrend line after making a little three-thrust pattern for High. The oscillator peaks have failed to endorse the last two mini-rallies.
But. To be honest, I'm not seeing the sort of wide-range days towards a peak that would convince me entirely that the computers have finished playing their games. This rally appears to be ending with a whimper, rather than an exhaustive bang. And that tends to make me more than a tad suspicious.
But. To be honest, I'm not seeing the sort of wide-range days towards a peak that would convince me entirely that the computers have finished playing their games. This rally appears to be ending with a whimper, rather than an exhaustive bang. And that tends to make me more than a tad suspicious.
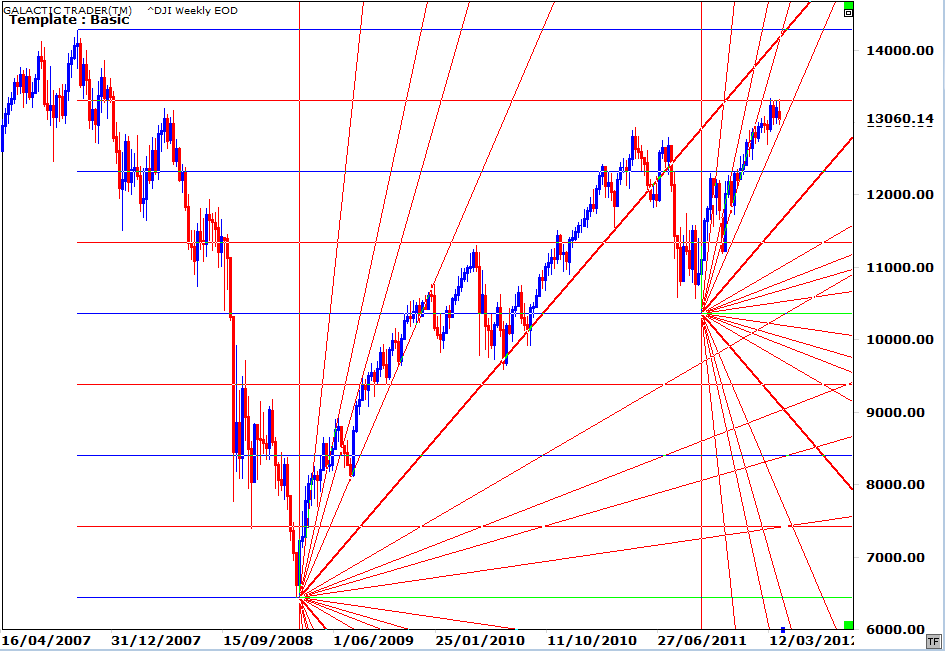
The black horizontal line on the earlier chart is an "obvious" target - and bounce point. It's the level of the DJI's 2011 High. The chart above shows what has been capping the index peaks over the past few weeks since we had the extreme optimism suggested by the Venus-Jupiter love fest in Taurus ... it's a Gann price division line which divides the price territory of the 2007-2009 Bear crash.
I've also attached two Gann fans; one at the 2009 Low and the other at last year's Low. After falling off the sharpest angles in the first stage of the post-crash recovery run, the index eventually attached itself to the primary Gann angle.
In the next couple of weeks, the index has to decide whether it can break above the price division barrier - or is going to fall off the fast fan line and track sideways to downwards for a meeting with the new primary Gann angle.
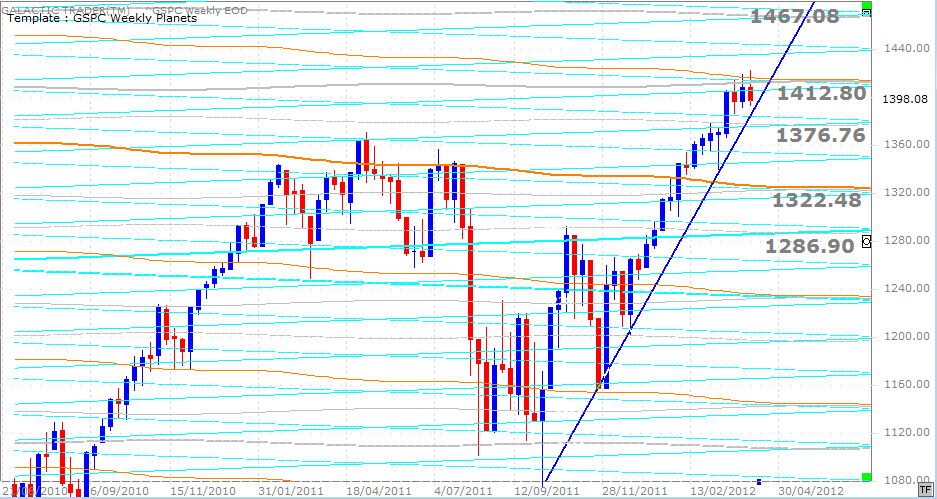
Pollyanna, the SP500, faces a similar decision in terms of Weekly Planets and her trendline (below).
I've also attached two Gann fans; one at the 2009 Low and the other at last year's Low. After falling off the sharpest angles in the first stage of the post-crash recovery run, the index eventually attached itself to the primary Gann angle.
In the next couple of weeks, the index has to decide whether it can break above the price division barrier - or is going to fall off the fast fan line and track sideways to downwards for a meeting with the new primary Gann angle.
Pollyanna, the SP500, faces a similar decision in terms of Weekly Planets and her trendline (below).
Yes, I finally got around to putting some price tags on the planetary lines so y'all didn't have to keep on guesstimating. They apply, though, only to the grey Neptune lines.
In the shortened Friday futures session, Pollyanna swooned to around 1380. If that's repeated in the real market this week, she'll lose the trendline. Again, the "obvious" level of initial Support becomes last year's High ... or, perhaps, the Saturn/Neptune level around 1376.
In the shortened Friday futures session, Pollyanna swooned to around 1380. If that's repeated in the real market this week, she'll lose the trendline. Again, the "obvious" level of initial Support becomes last year's High ... or, perhaps, the Saturn/Neptune level around 1376.
The medium-range Canary on the SP500 weekly continues to deteriorate in comparison with the price and has now dropped below the +100 level, indicating some signs of a potential to follow the FTSE lower.
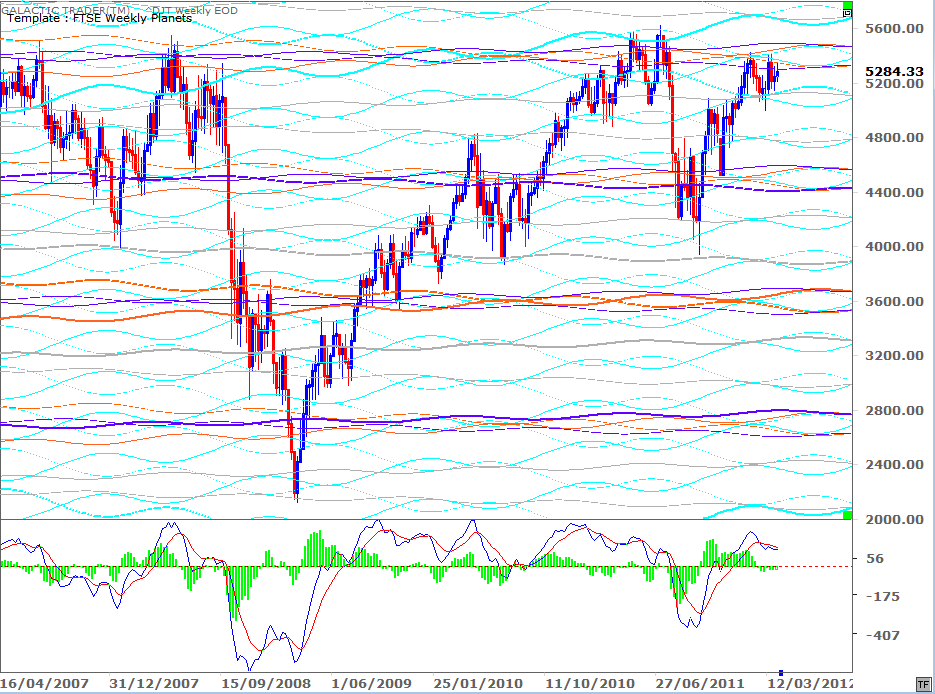

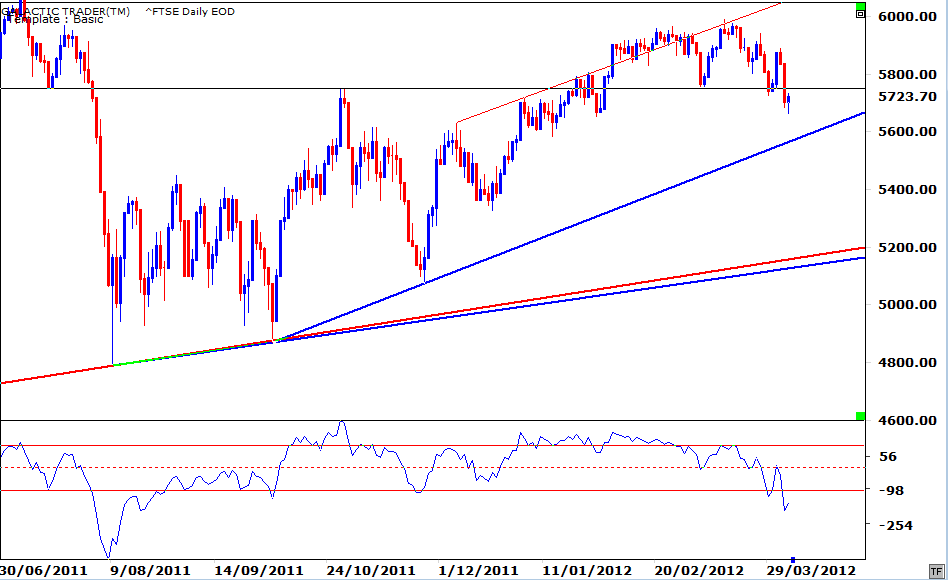
I indicated last weekend that the FTSE was showing the first signs of panic and remarked: " ... with the long-range Canary displaying negative divergence at the price highs and warning now that further price weakness lies ahead."
After further bounce from the "obvious" on Monday, the Canary proved itself right when we got the "further price weakness ahead". What comes next is a tad more difficult to predict. Obviously, the thick, shallow blue trendline should provide Support if there are further drops. And I remain suspicious about those negative headlines on Wall Street now that the statistical negativity of the Full Moon is passing. And yet, there are some signals from the FTSE Daily that the index may already be in panic down mode.
After further bounce from the "obvious" on Monday, the Canary proved itself right when we got the "further price weakness ahead". What comes next is a tad more difficult to predict. Obviously, the thick, shallow blue trendline should provide Support if there are further drops. And I remain suspicious about those negative headlines on Wall Street now that the statistical negativity of the Full Moon is passing. And yet, there are some signals from the FTSE Daily that the index may already be in panic down mode.
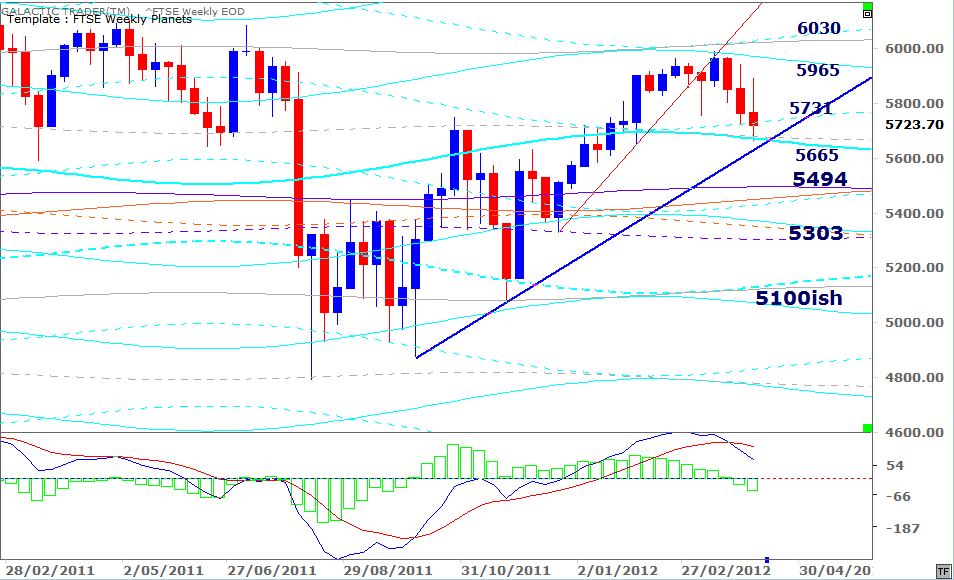
Hey! But that's why we have Weekly Planets charts, eh ... to give us an indication of where a "measured" move is likely to find Support and/or Resistance?
Okay, okay ... so they're not "technical". Nevertheless, I went on a little waffle about the significance of the grey Neptune line on this chart last weekend and you can wander back and review that, rather than my reiterating it all again. Oh, while I'm on the subject of the Archives. Mercury Rx has set some sort of gremlin loose and at least on my computer some of the link buttons are throwing up erroneous date data in the cyberspace transfer. If you go into the 1st Quarter Archives and it looks as if I'd had three glasses too much Canadian whisky while typing, I can assure you it was only two glasses. The buttons go down in order and the links are working properly, regardless of whether March appears where February should be on the buttons.
Okay, okay ... so they're not "technical". Nevertheless, I went on a little waffle about the significance of the grey Neptune line on this chart last weekend and you can wander back and review that, rather than my reiterating it all again. Oh, while I'm on the subject of the Archives. Mercury Rx has set some sort of gremlin loose and at least on my computer some of the link buttons are throwing up erroneous date data in the cyberspace transfer. If you go into the 1st Quarter Archives and it looks as if I'd had three glasses too much Canadian whisky while typing, I can assure you it was only two glasses. The buttons go down in order and the links are working properly, regardless of whether March appears where February should be on the buttons.
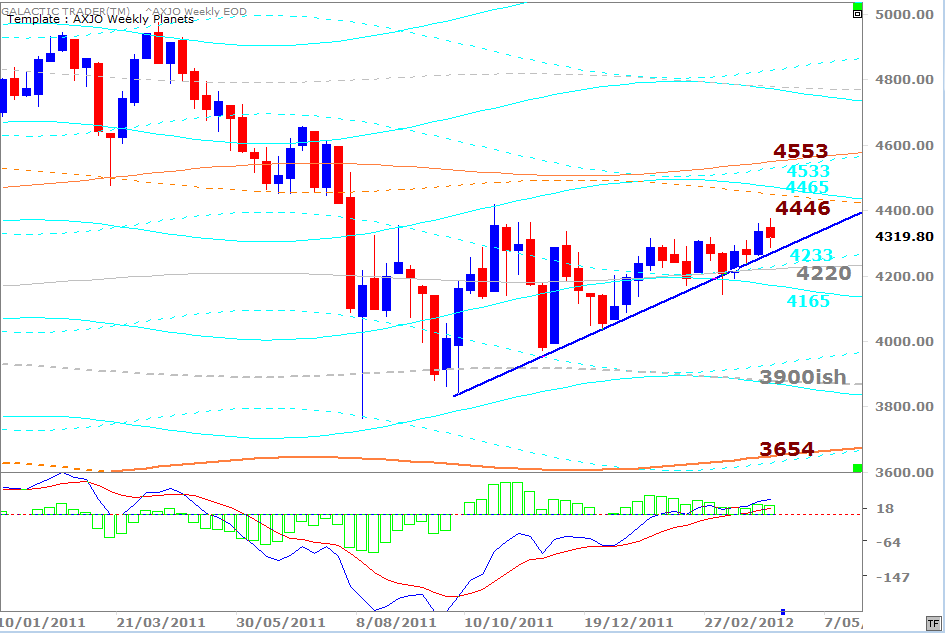
And since I've blathered on enough for one week, I'll leave you with Auntie's Weekly Planets. For the moment, the ASX200 is still technically in breakout mode, rather than breakdown ... and that remains the case so long as she does not close decisively below the 4300s. The technical target for the move is around the 4500s, though the Weekly Planets chart indicates there'll be a stall in the 4400s.
If the breakout holds.
If the breakout holds.