
Negative news likely with 1Q-FM cycle
Week beginning April 30, 2012
After starting last week with a bad mood Monday, most world indices recovered, rising into this weekend's First Quarter Moon.

Copyright: Randall Ashbourne - 2011-2012
Those of you who have studied The Moods of The Moon chapter will realise that while, statistically, markets have a tendency to go sideways-to-down from New Moon to Full Moon, it is often not profitable to go Short immediately at the New Moon date.
The table on Page 19 shows that Shorting the SP500 from NM-1Q during the first 6 months of 2011 resulted in a small loss overall. However, that table also shows there was a distinct tendency for the index to drop 1Q-FM during that half-year period.
And that's what we're in this week - the period between 1st Quarter Moon and the Full Moon. It will coincide with Mercury opposing Saturn, indicating investors will turn their minds again to the challenges facing future growth prospects.
These are not major Spooky Stuff signatures, but in the absence of stronger influences are likely to have a very short-term impact.
At the least, they suggest it will be a tad difficult for markets to repeat the sort of performance we saw last week when news of Apple's strong earnings held more sway than further debt downgrades in Europe.
That was a Sun trine Pluto effect; Mercury opposed Saturn is more likely to be a dose of unwelcome reality.
I indicated last weekend there are no significant astrological aspects to affect markets until mid-May.
This weekend's 1Q Moon occurs with the Sun making a trine aspect to Pluto, which is a relatively minor influence with a positive bias.
This weekend's 1Q Moon occurs with the Sun making a trine aspect to Pluto, which is a relatively minor influence with a positive bias.


However, as I indicated, these are minor influences, unlikely to prompt a significant change in trend, in either direction.
We'll return to normal mode this weekend, reviewing Pollyanna, the FTSE and the ASX200 to see what the technical conditions suggest for the week ahead.
And first of all, I want to deal with signs of reasonable strength. It's one thing to have expectations of what ought to happen, but the charts sometimes just don't necessarily agree.
And first of all, I want to deal with signs of reasonable strength. It's one thing to have expectations of what ought to happen, but the charts sometimes just don't necessarily agree.
Safe trading - RA
(Disclaimer: This article is not advice or a recommendation to trade stocks; it is merely educational material.)
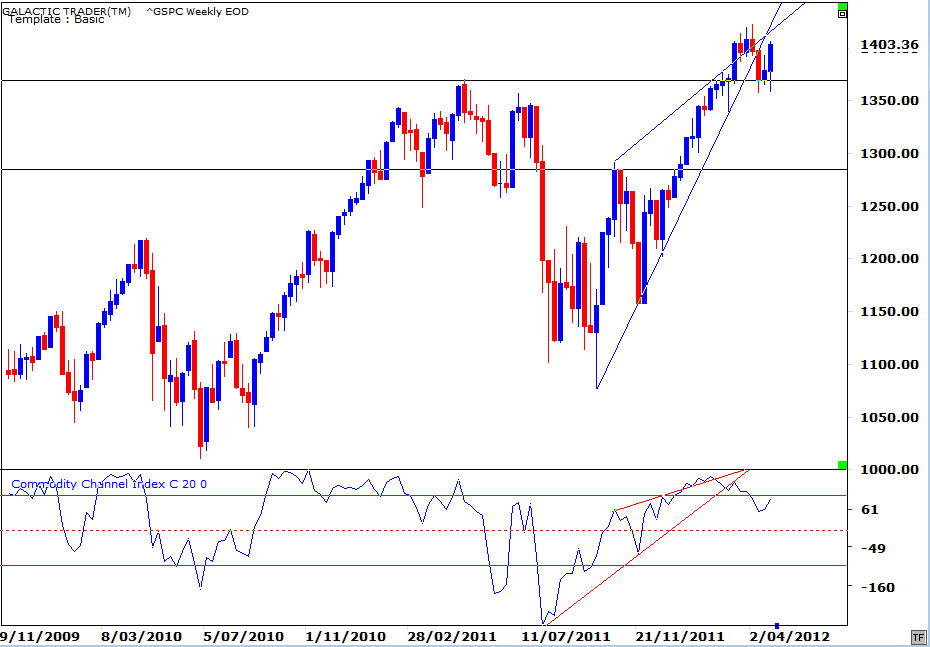
Let's begin with the weekly chart for the SP500 and concentrate on the action since the August/October spikes down last year.
We need to remember that most of the world's indices have not taken out last year's Highs in the recovery rally from that sudden plunge. And as crazy as we might think it is, we simply have to respect the fact ... for the moment ... that Pollyanna not only broke above the barrier, but is now trying desperately to use last year's Highs as a springboard for further rally.
There's no need to over-analyse this; it's simple. There's a horizontal black line around 1370 at the level of last year's High and the Bulls are working overtime to defend it. There have been three brief spikes below it and the Bulls have stepped back in to force a close above the line.
Now, it is true that the medium-term oscillator is continuing to weaken and that the slope of the rally has fallen off its too far, too fast trendline. All we really need to know is exactly where the Bulls have drawn their line in the sand. The simple fact is Support is still showing up at a very high level.
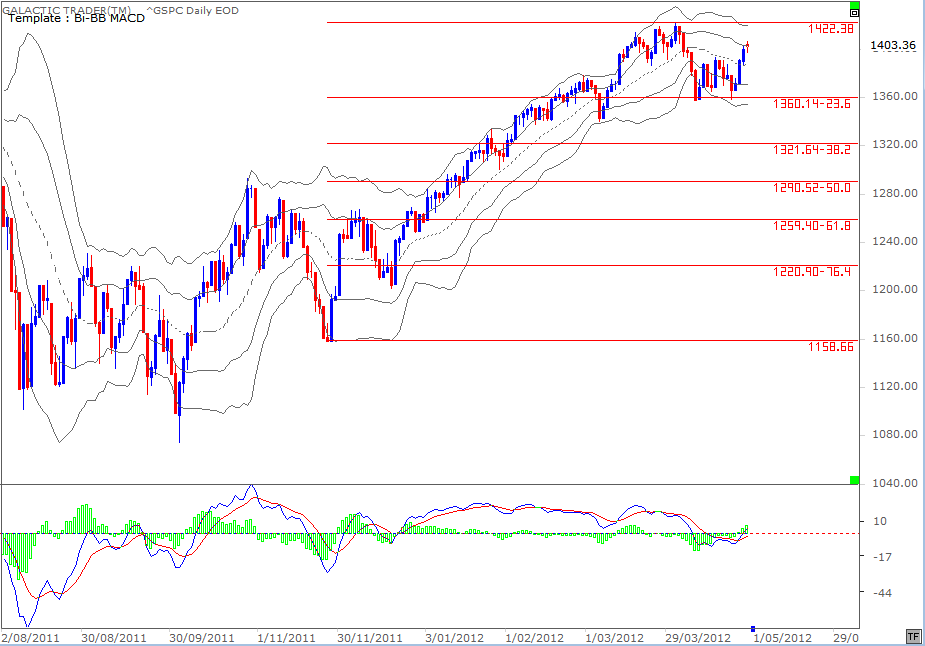
There are further signs of strength in the 500's daily chart. As the Bi-BB's tightened, we saw a fast move. This chart is a textbook illustration of the points I make in The Technical Section in the chapter dealing with Bi-BBs. Tightening bands mean a fast move is coming; the first move is often in the wrong direction; a break of the outer bands usually stops the immediate trend and results in either a sideways consolidation or a turnaround.
We can see all of those things happening on this chart over the past few weeks. We also see the positive divergence which developed in the fast MACD at the two Low marks.
And we can also see that the correction downwards held the tightest level of Fibonacci retracement.
So, overall, we might expect and anticipate further weakness, but the combination of the two charts tells us that the Bulls are determined to defend the rally.
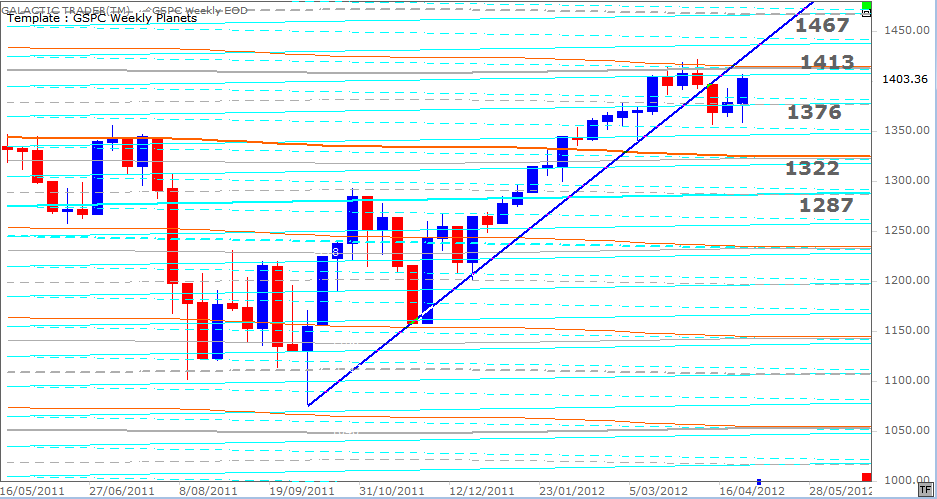
Polly's Weekly Planets chart is above and shows the weekly markers and targets quite clearly.
So, let's go to the FTSE.
So, let's go to the FTSE.
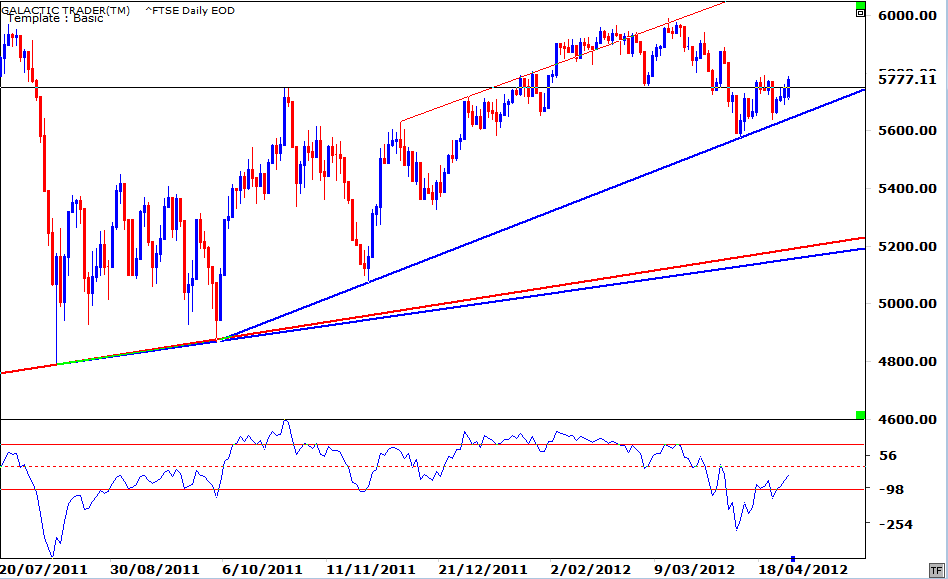
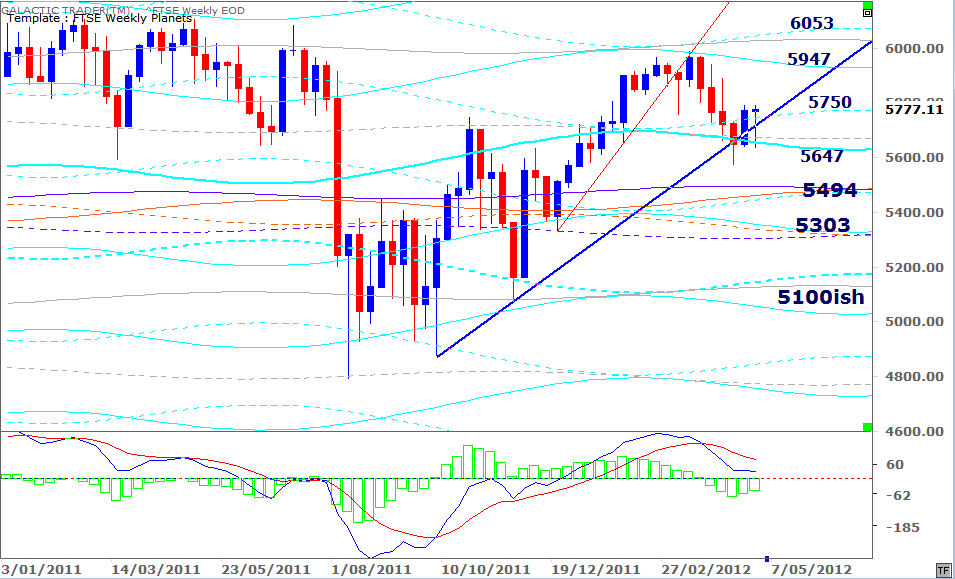
The FTSE is one of those indices which isn't even close to getting above last year's price levels. If it were in the same position as the 500, it would now be trying to consolidate above 6100.
Instead, it has dropped to a very shallow rising trendline and the London Bulls are trying to keep that one alive.
The FTSE Weekly Planets chart is below, with some useful Price targets - in both directions.
Instead, it has dropped to a very shallow rising trendline and the London Bulls are trying to keep that one alive.
The FTSE Weekly Planets chart is below, with some useful Price targets - in both directions.
As with London and New York, there's also no need to agonise over Auntie, the ASX200.
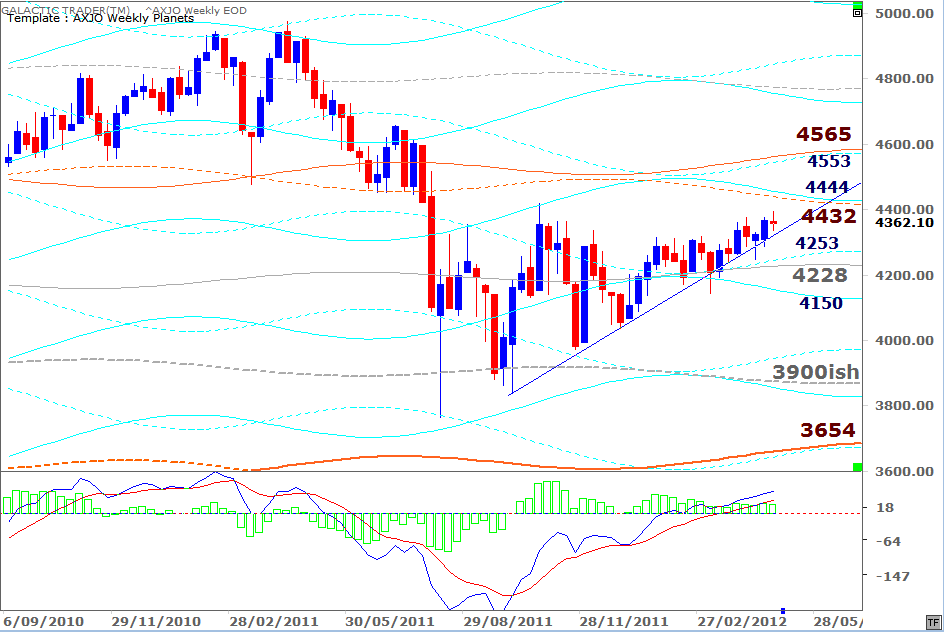
The old girl is managing to close each week above the rising trendline ... there is little disagreement from the fast MACD, though the histograms continue to shrink ... and the overhead planetary targets have not yet been reached.
Missing from this chart is a 1st Harmonic Pluto line priced at 4405 for the weeks ahead. It has, in the past, acted as both Support and Resistance and would need to be cleared decisively if the index is going to challenge the 4500s.
Overall then, we are entering the influence of a negative lunar phase which has some potential to cap further rises in the week ahead and if the statistical tendency holds true-to-form, declines are more likely than increases. However, there are no dramatic signals from the technical charts telling us to get the hell out of Dodge fast.
We have clear technical levels and planetary prices to use as guides for as long as the Bulls are feeling bullish.