
Saturn, gold and WPs for TSX and Asia
Week beginning April 29, 2013
Markets rallied last week between 3 of the 4 astrological aspects reviewed in last weekend's edition.

Copyright: Randall Ashbourne - 2011-2013
If markets continue rising into the aspect - and that is certainly possible given it's the end of the month - we will all need to watch target levels and oscillators very carefully for signs of a potential intermediate peak.
There are still no major alarm bells going off in the SP500's monthly charts, but signs of weakening are starting to become obvious in weekly charts.
However, since it has been a while since I reviewed the state of the Asian indices and because I neglected to update Canadian readers recently when I published updated Weekly Planets charts for Western indices, most of this edition will deal with those markets.
We'll also take another look at gold. I had an email exchange with an Indian businessman during the week who is tipping significant reversals in gold prices on May 10 and 17, based on his interpretation of the Vedic aspects.
It started with Venus in opposition to Saturn and continued into the lunar eclipse Full Moon (with the Moon conjunct Saturn) and tended to stall going into this weekend's Sun opposition Saturn aspect.
The remaining one of the four, and perhaps the most important, arrives midway through the coming week - Mars opposed to Saturn.
The remaining one of the four, and perhaps the most important, arrives midway through the coming week - Mars opposed to Saturn.


Safe trading - RA
(Disclaimer: This article is not advice or a recommendation to trade stocks; it is merely educational material.)
I am by no means any sort of an expert on Vedic astrology, which forms part of the daily culture of Hindu society. However, I do know from past studies that it tends to be much better than Western astrology at predicting actual events and timing. As always, the accuracy of the forecast depends on both the skill and the bias of the interpreter.
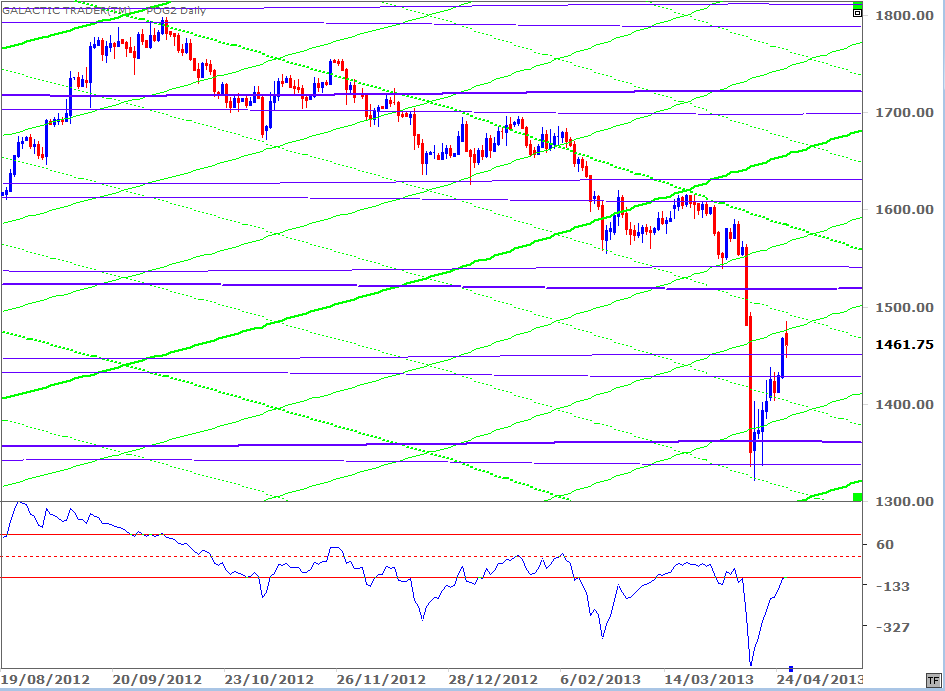
The bounceback in greenback gold prices has been strong - and continues to conform to the planetary charts I revealed this year in Forecast 2013.
The bounceback in greenback gold prices has been strong - and continues to conform to the planetary charts I revealed this year in Forecast 2013.
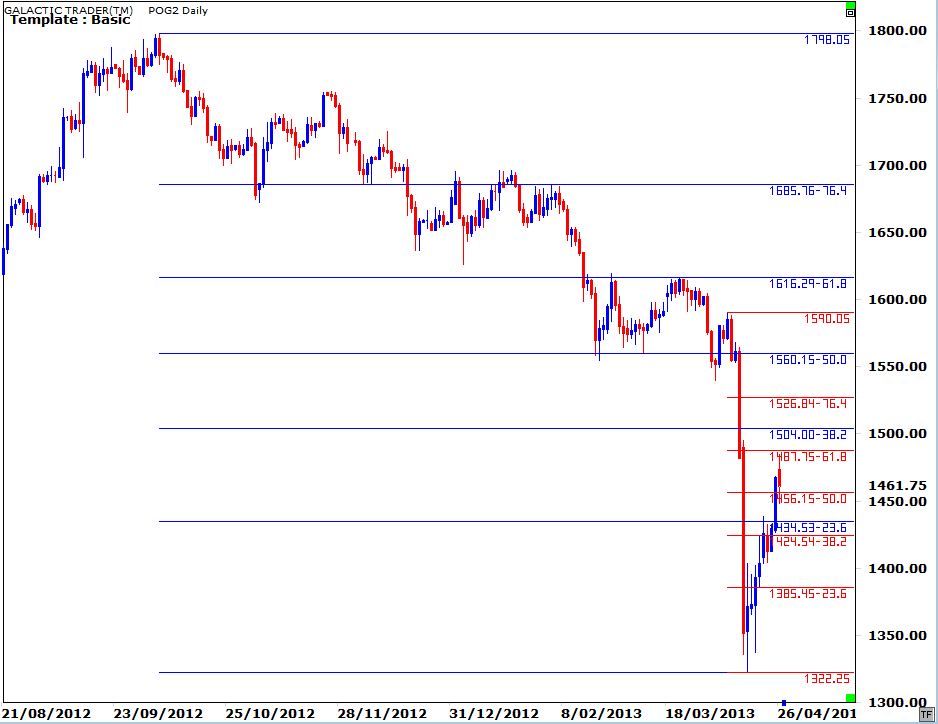
Over the past couple of weekends, we've discussed gold at some length and in the Archives you will find the weekly chart with the major price targets marked. For those of you trading gold, or gold miners, without the benefit of the planetary charts, the Fibonacci retracement levels provide alternative targets.
Forecast 2013 is now available for sale and download.
Click the button on the right for more details.
Click the button on the right for more details.


Forecast 2013 is now available for sale and download.
Click the button on the right for more details.
Click the button on the right for more details.
Obviously, the red FiboRx levels deal with only the recent nosedive, while the blue levels show a wider range from an earlier peak. What is interesting, at least at a surface level, is the apparent importance of 50% markers - something the ASX200 does often. Last week's continued bounce went close to recapturing the 618 FiboRx of the sharp downleg, before ending the week near the 50% marker.
Now that we have a wider range to view, we can see that the sideways shuffle before the plunge also took place within what can now be defined as a 618-50% horizontal zone. Important consolidations, either up or down, often become a 50% range marker. It could mean the gold correction is over. I'm still quite uncertain that is the case - and I wouldn't be confident about the resumption of a gold bull market until I see a marginally lower price trough accompanied by a higher low in the long-range oscillator.
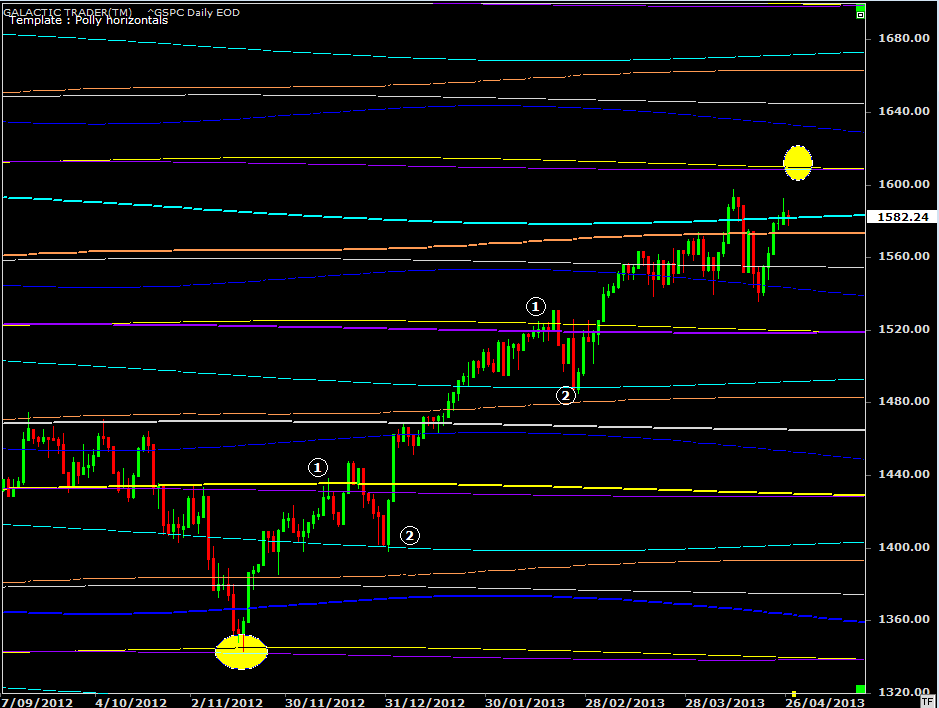
Before turning to Canada and Asia, let's take another quick look at a chart I published recently for Pollyanna, the SP500.
Now that we have a wider range to view, we can see that the sideways shuffle before the plunge also took place within what can now be defined as a 618-50% horizontal zone. Important consolidations, either up or down, often become a 50% range marker. It could mean the gold correction is over. I'm still quite uncertain that is the case - and I wouldn't be confident about the resumption of a gold bull market until I see a marginally lower price trough accompanied by a higher low in the long-range oscillator.
Before turning to Canada and Asia, let's take another quick look at a chart I published recently for Pollyanna, the SP500.
I indicated recently Miss Polly may be embarked on a run between different Uranus/Pluto planetary lines - a run which began at the lower yellow oval and may be heading for the higher oval, priced at around 1609.
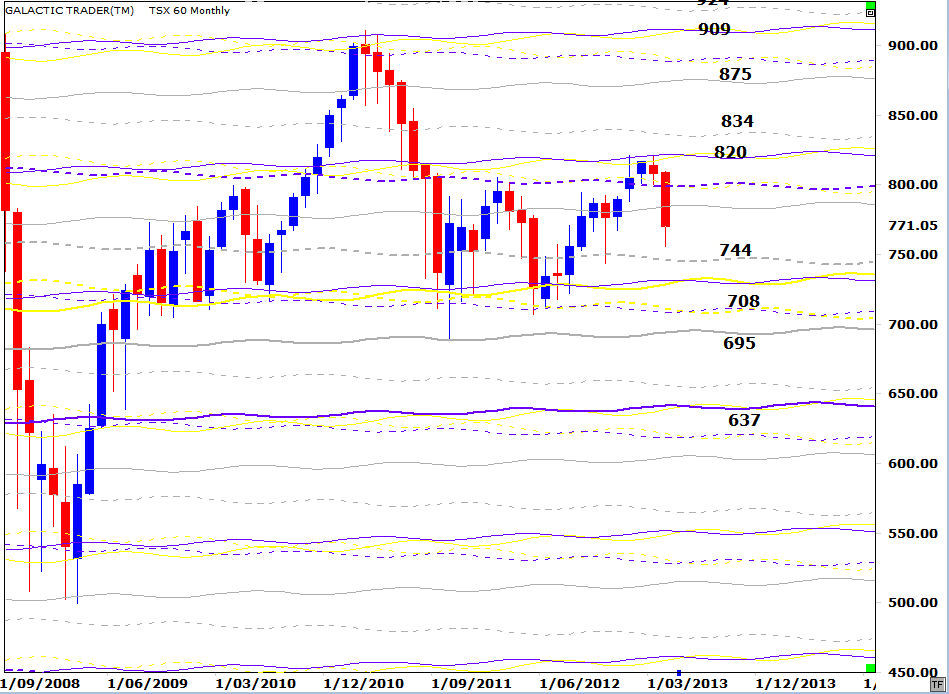
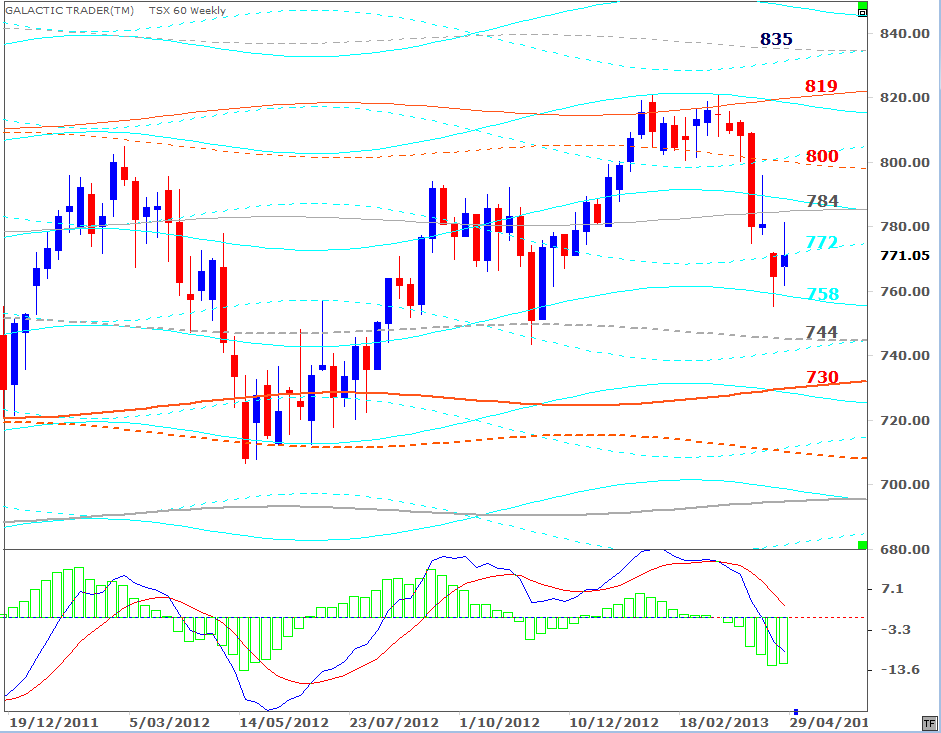
Now, my apologies to Canada. I forgot to update you when I last looked at the Western indices. So, to make it up, I'll give you both a Weekly Planets chart and a long-range version, starting with the latter.
Now, my apologies to Canada. I forgot to update you when I last looked at the Western indices. So, to make it up, I'll give you both a Weekly Planets chart and a long-range version, starting with the latter.
And the Weekly Planets chart, with a narrower range of price targets, is below.
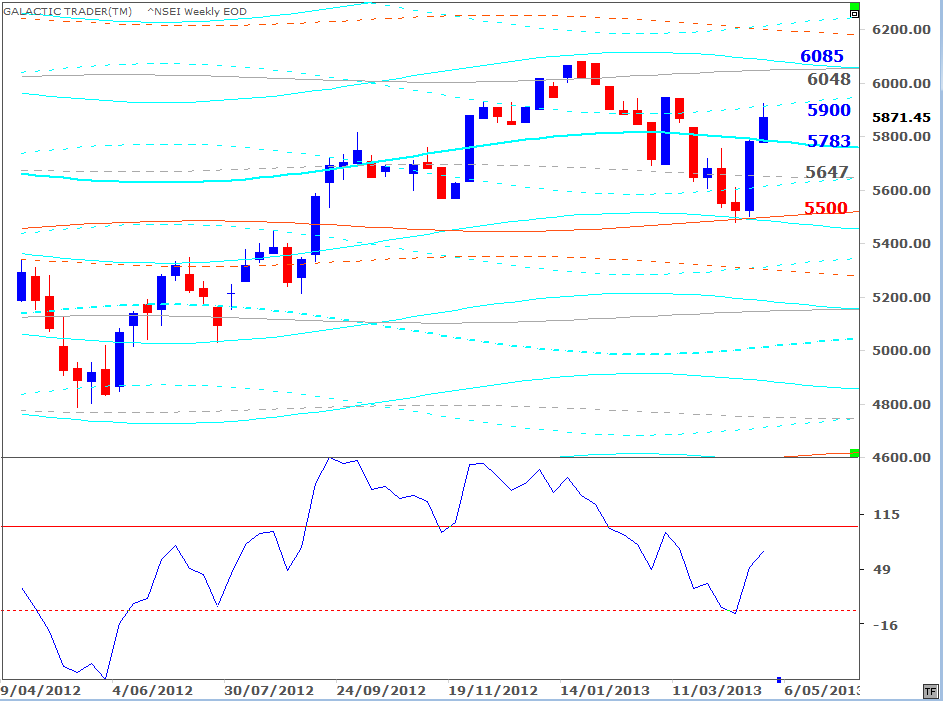
India's Nifty50 is next. It put in a recent bottom at a Saturn/Uranus level - and backed off last week from a weekly Saturn line. If the index is going higher, it could have the next Saturn/Uranus zone as a target - around the 6200s.
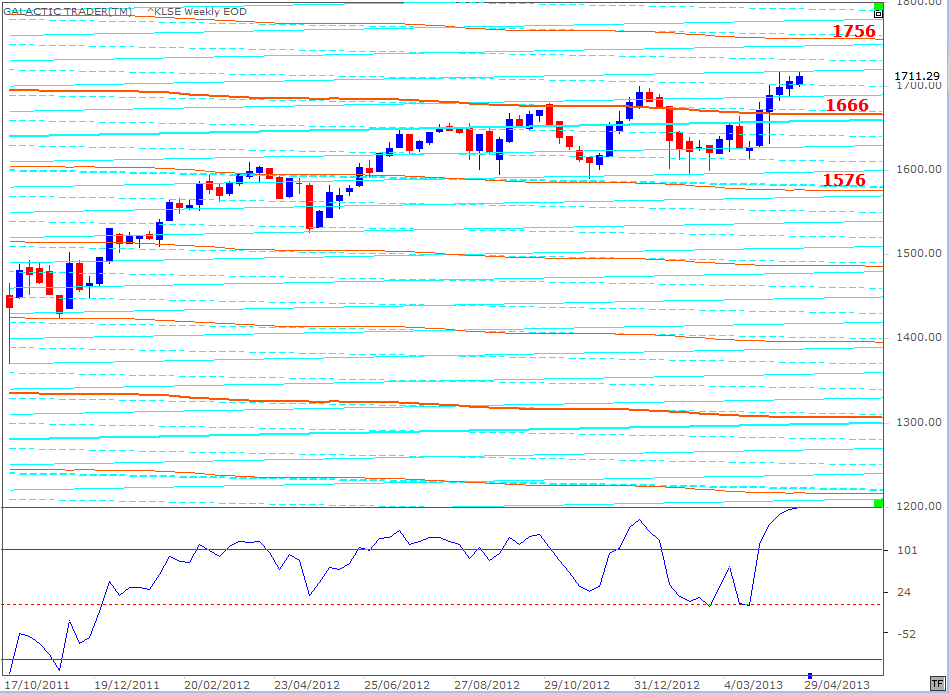
Next we go to KL, which has a tendency to target Node lines for major moves, with interim stalls at Saturn levels. The small-range stalling in the past few weeks is fairly obvious, but the oscillator isn't wavering and, having overcome the 1666 Node line, the next major target is in the 1750s.
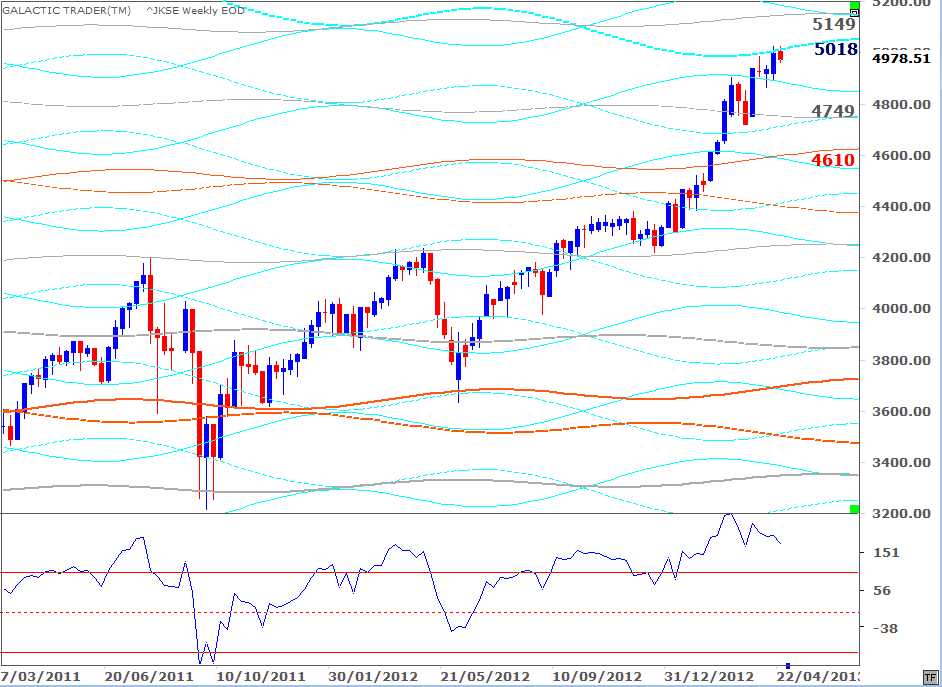
Jakarta appears to be in a weaker position. It has been trapped by a primary overhead Saturn - and the oscillator is declining. Since the oscillator is still well above the +100 level, it is possible it could turn out to be a continuation pattern and there'll be a new surge to about 5150, which is the next highest Neptune level.
If you look at the chart, you can see the past importance of the grey Neptune lines. Having consolidated on top of the last one now priced at 4750ish, the higher level does seem to be a valid target.
If you look at the chart, you can see the past importance of the grey Neptune lines. Having consolidated on top of the last one now priced at 4750ish, the higher level does seem to be a valid target.
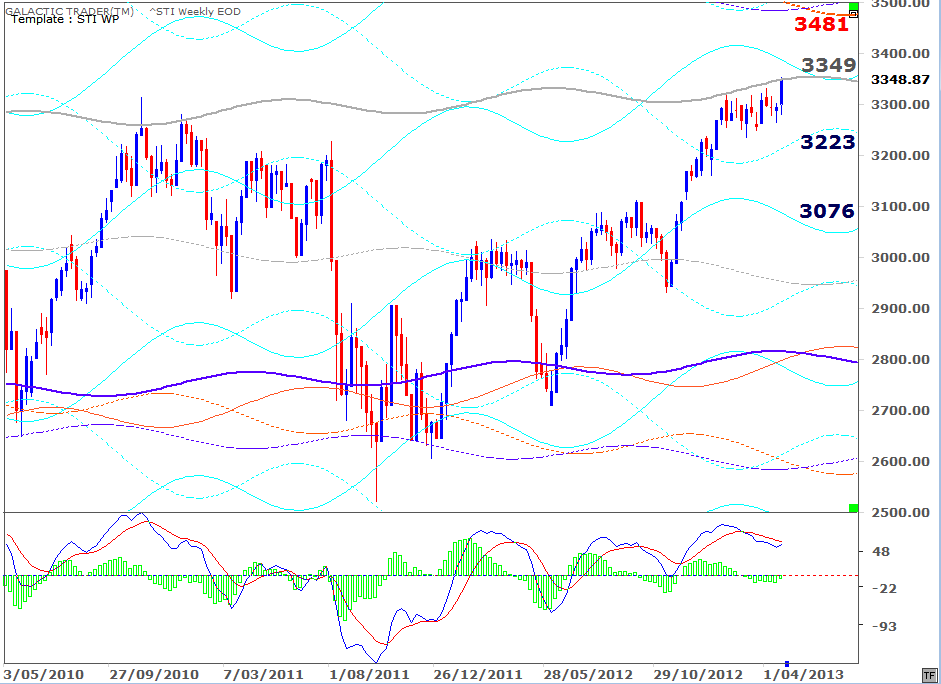
Up to Singapore, where there has been much to-ing and fro-ing as the index consolidates below the primary Neptune level which capped the STI's 2010 price peaks. The falling highs of the MACD histogram peaks indicate growing internal weakness - and this Neptune level is obviously a strong one. Breakout puts the 3500s as the next major planetary barrier.
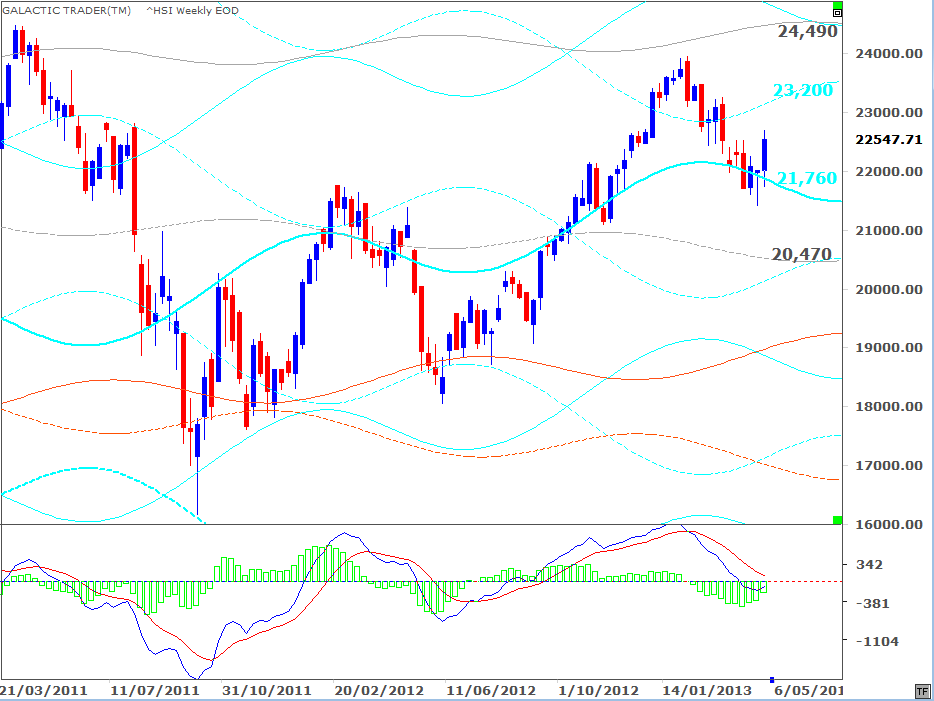
Over to Hong Kong, where the Hang Seng has recovered from an apparent false break below a primary Saturn.
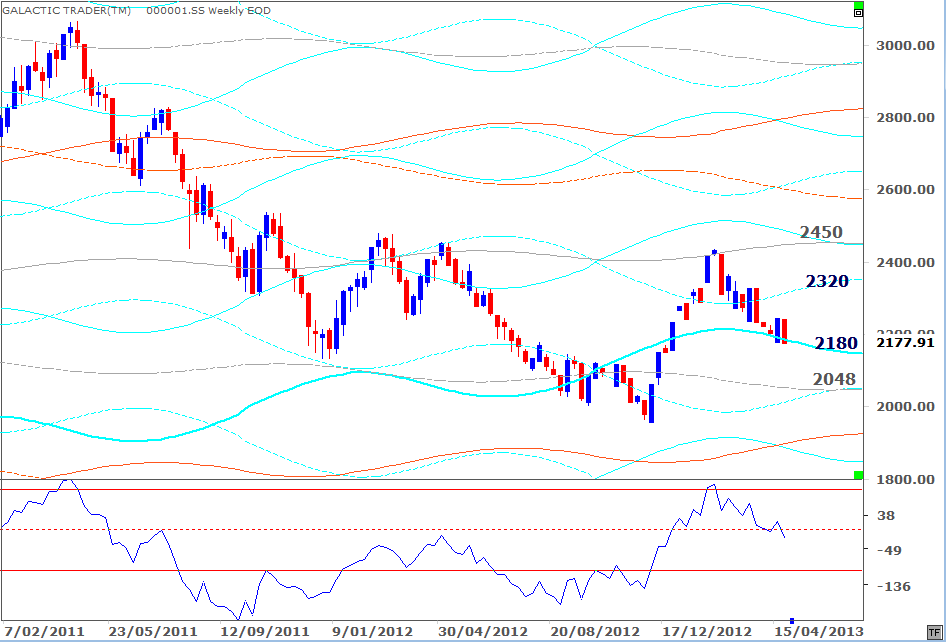
And next a quick visit to Shanghai ...
And, finally, to the ASX200 ...

And that's a wrap for this weekend. The target prices within the Weekly Planets charts don't change too much from one week to the next, so you might want to keep track of your favorite index until these are updated again in a few weeks.