Planetary prices for the DAX and TSX60
Week beginning April 23, 2012
There will be no concentration on Wall Street, London and the ASX 200 this weekend.

Copyright: Randall Ashbourne - 2011-2012
And we both know that despite our best intentions, we still spend far too much time dilly-dallying over the daily fluctuations in The Vacuous Troll - Pollyanna.
I think you'll find this edition interesting, especially since we'll review precisely what happened with the TSX60 since we last took a look at it in late January.
With The Spooky Stuff, there's not much happening until the next New Moon - in Gemini - next month. It'll be a solar eclipse and my good friend and colleague, Marlene P, over at Astrological Investing, has been busy preparing a special report. Membership of her site is free and you can sign up to receive her monthly newsletter on New Moon impacts, if you want to learn a little more about astrology without being bewildered.
In the Old Gods chapter of the book, I explain how both long-term and intermediate trends tend to strive to reach, and get turned away from, specific price targets determined by planetary price lines - and that some indices seem to have specific planets they're tuned into.
There was an example of it with the SP500's long-range chart I showed again last weekend and we frequently look at my Weekly Planets charts for Pollyanna, the FTSE and the ASX200.
I promised at the beginning of the year that I would try to find more time to look at other indices.
If you think you've nothing to learn by this weekend's closer look at Canada and Germany, then I have to disagree.
Personally, I think Wall Street is so manipulated, it's often more rewarding - and far less stressful - to play other markets.
If you think you've nothing to learn by this weekend's closer look at Canada and Germany, then I have to disagree.
Personally, I think Wall Street is so manipulated, it's often more rewarding - and far less stressful - to play other markets.


This weekend, we're going to review the Toronto market again ... and take a closer look at Germany's DAX.
In future weeks, I'll return again to India's NIFTY and try to take a specific look at some of the other Asian indices. I know there are a lot of you in Macau, Singapore and Hong Kong logging-in each weekend.
Okay, let's get the process underway.
On January 30, I took a look at the TSX60 and that report is available in the 1Q Archives. (The gremlin is still there, so look by article title and press the button next to it, rather than relying on the date.)
Okay, let's get the process underway.
On January 30, I took a look at the TSX60 and that report is available in the 1Q Archives. (The gremlin is still there, so look by article title and press the button next to it, rather than relying on the date.)
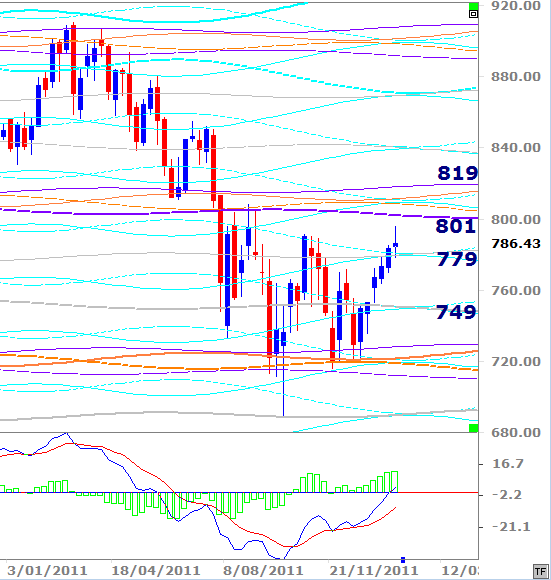
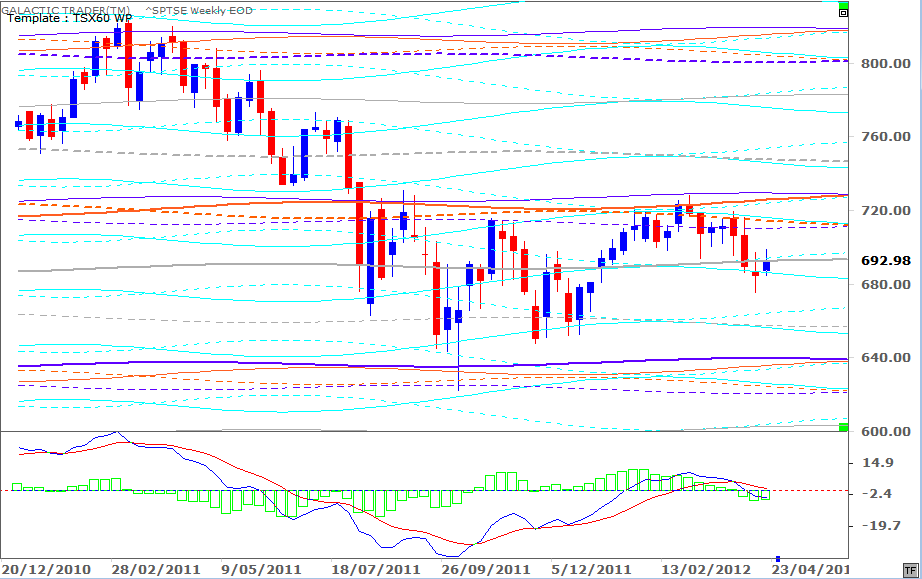
This is one of the charts we looked at in that report - a Weekly Planets chart for the TSX with prices marked to help determine the "probable" Support/Resistance targets for intermediate-range trends in the index.
I said at the time:
"So we decrease the zodiacal range for the three major Old Gods and throw Saturn into the mix because he's the God of Restrictions (and boundaries and Time). And, like a typical Capricorn, he's utterly convinced He Knows Best.
And abracadabra, lo-and-behold ... we have an extremely useful chart, as we do for Pollyanna, Auntie and the FTSE, for determining some excellent, safe and very profitable Entry and Exit points to ride intermediate-term rallies and declines."
I then went on to use a Bi-BB chart of the TSX daily bars and made these comments:
"On a daily chart, the TSX60 is ringing a lot of alarm bells ... rapidly-contracting BBs, dropping MACD histograms which have just slipped below the Zero line, a MACD signal line also going negative.
Do I need to harp and nag? Might as well ... what's a Virgo Moon for, if not for that, eh? Look at the forest FIRST ... use the weeklies to determine the probable price targets up or down ... and only then study the dailies to find out if the current trend is ailing or still strong so you can put your boodle to use."
So, now, let's review exactly what happened with that index since I made those comments on January 30.
Safe trading - RA
(Disclaimer: This article is not advice or a recommendation to trade stocks; it is merely educational material.)
The original chart made it pretty clear the index would face potentially strong Resistance as it hit the 801 price level ... that there was Support which would come into play around the 779 level during any back-off from 801 ... and below that, there would be little further Support until 749.
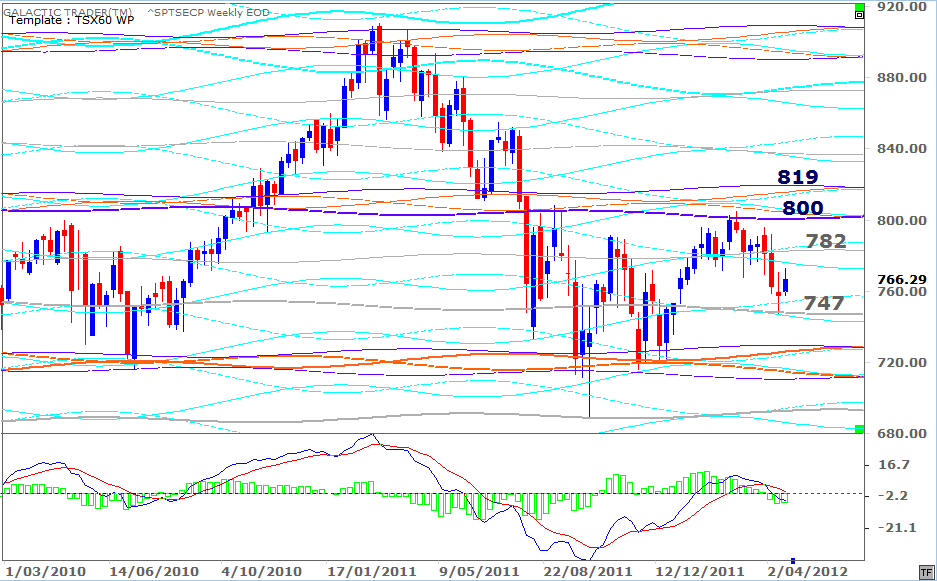
Well the peak of the rally logged in at 805 and the decline stopped at 747.
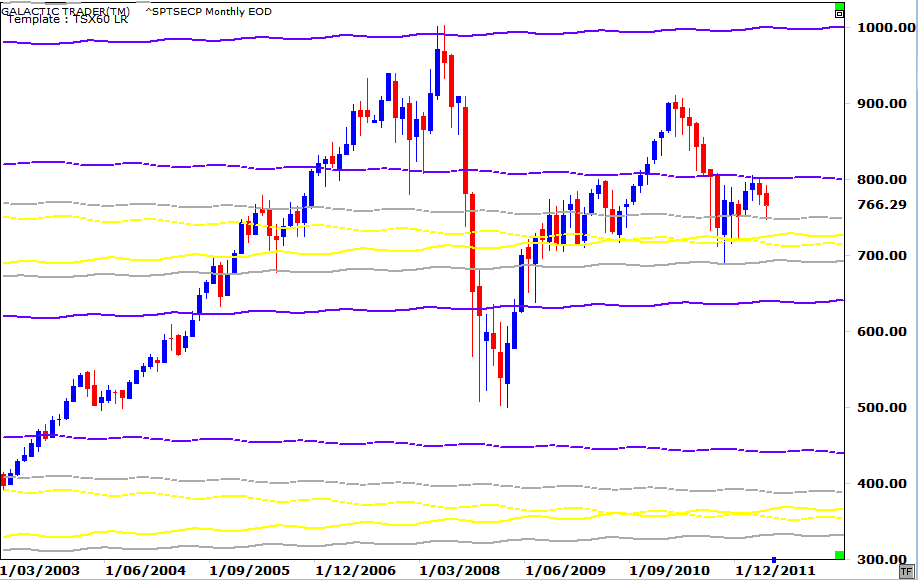
In that weekend's edition, in explaining how to find the long-range planetary markers, I revealed this:
"The dark Lord of the Underworld, Pluto, is the main long-range Old God who keeps the TSX60's price moves under lock-and-key ... with some interim-move assistance from the weirdo, Uranus, and from Neptune."
And below, I'll use that chart again, updated with the price bars from the past few months.
Well the peak of the rally logged in at 805 and the decline stopped at 747.
In that weekend's edition, in explaining how to find the long-range planetary markers, I revealed this:
"The dark Lord of the Underworld, Pluto, is the main long-range Old God who keeps the TSX60's price moves under lock-and-key ... with some interim-move assistance from the weirdo, Uranus, and from Neptune."
And below, I'll use that chart again, updated with the price bars from the past few months.
Pretty damn easy to see where the index is going to stop next if it loses the 747 Loonie territory, non?
There are two TSX60 indices, one of them "capped". I'll deal with the other index next. Now, there are a couple of reasons we're making this trip this weekend.
Firstly, I have a lot of Canadian readers and book buyers; thanks largely, I think, to the constant promotion by my friend, Hal Martin. I want to revisit the TSX as a thank you to Hal and all his fellow moose moss lickers.
Secondly, this is a follow-on from last weekend's letter from Andreas K., who was kind enough to write and thank me for relieving some of the over-analysis agony he'd suffered from.
The point is twofold ... if Pollyanna drives you up the wall as much as it does me, there are other indices that can be traded; and if you tune out the news and the dithering over the dailies, there are certain points where one can Enter and Exit the trades in those indices with a high level of confidence and, above all, safety.
Now, I suspect most of you will find actual trading vehicles, like ETFs and CFDs, are based on the second version of the TSX60. The planetary price impacts are the same.
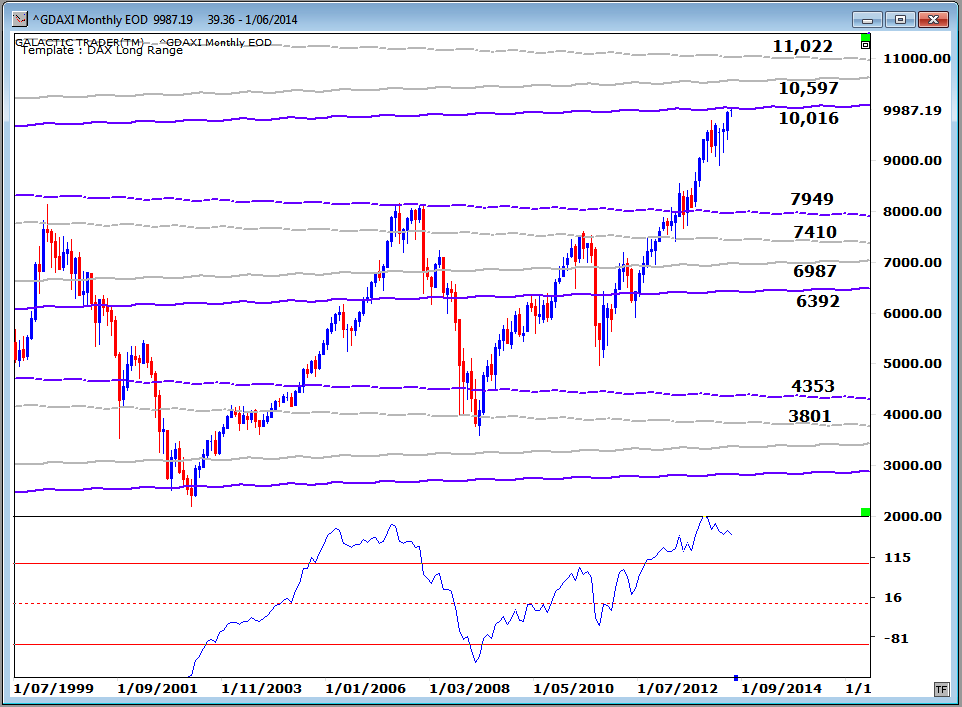
Remember that I indicated on January 30, and reiterated above, that the major Old Gods dictator of the TSX is Pluto - and in the chart above I've narrowed the zodiacal range down to 90 degrees, rather than the broad 360 degrees.
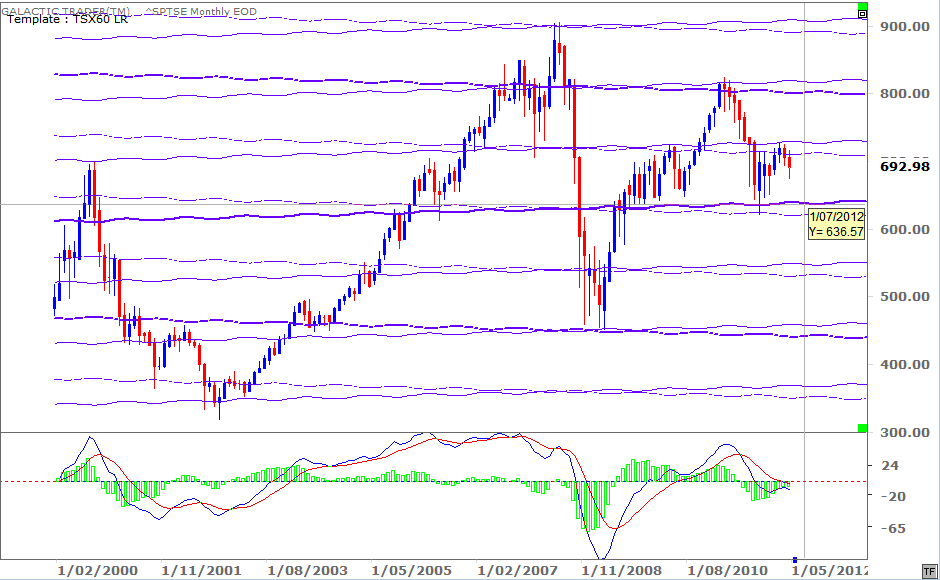
I've placed the crosshair cursor at the primary Pluto line on the downside - indicating potential downside to around 636, if the overhead Resistance continues to hold. Again, we have a potential long-term head-and-shoulders pattern forming.
You'll see that in the first stage of the post-crash recovery, the index stalled at the Pluto level, bounced around between them, and then broke through the resistance before stalling out again at a higher Pluto level. So, we can be fairly confident, just by reviewing the price history of the index, that Pluto is the ruler of its long-range trends.
And now we see we can also apply the Weekly Planets template to this other version of the TSX60, despite the price difference, and that it continues to be useful for calculating the topping and bottoming levels for intermediate trends.
Okay, now let's go to Germany.
Okay, now let's go to Germany.
Now while Pluto is head honcho for Canada, the DAX responds most frequently - over the long range - to price levels determined by the position of Uranus in the zodiac. You might remember that the Old God for Auntie, the ASX, is Neptune.
Overshoots and undershoots on the long-range planetary charts are not at all uncommon - and that's why we also use Weekly Planets charts once an intermediate trend is underway.
However, you know my maxim ... use the long-range, monthly charts first - so that you have a broad overview of the forest as a whole. And it's the weirdo, Uranus, who sets the big picture for the DAX.
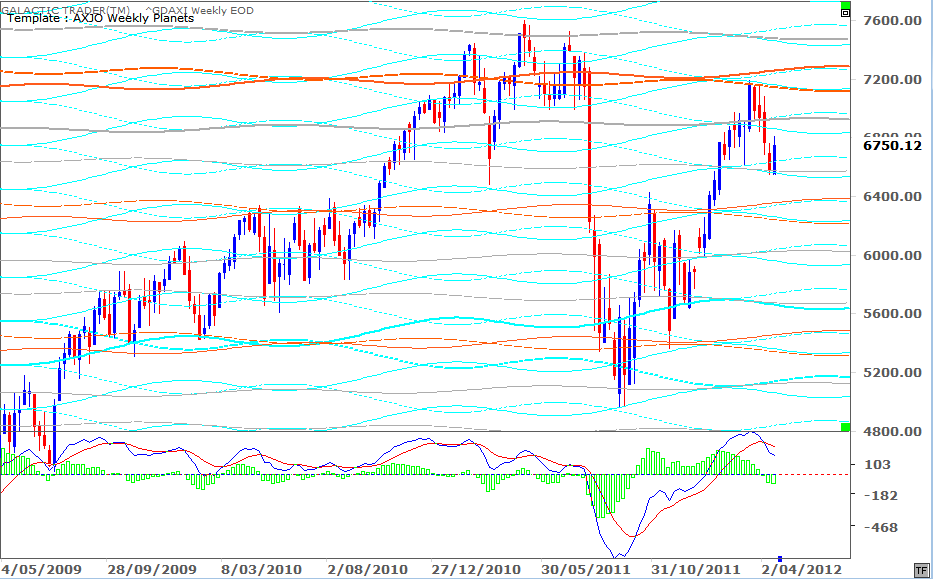
So, next we apply a Weekly Planets template to the index. The FTSE, the ASX and the DAX all move within the same broad price ranges - so I simply use my ASX template for a guide on where the DAX will strive to hit, or stall.
We can see from the chart above the continual strength of the Uranus lines in providing major Support or Resistance ... and we can also see how the other Old Gods, Neptune and Saturn get themselves involved in the intermediate ranges.
Now, I would hope all of you have found this weekend's edition to be both interesting and informative - not just the Canadians and the Germans.
I realise it's neither technical, nor mundane astrology. However, the Old Gods chapter is one of the key sections of The Idiot & The Moon for those of you who really want to know what moves markets over the long-range and intermediate terms - regardless of the games played by the GS and JPM computers.
I do caution that it is employment of the three-timeframe Idiot system which should be your primary guide to trading profitably, reliably and safely.
But, I think this exercise does show the where of precisely where and when to look for high-probability turning points, when The Idiot is telling us a long-range, or intermediate, trend is changing course.
Yes, yes ... I suppose I'll have to turn my attention to Pollyanna again next week. But, until then ...