Early signs of the panic brewing
Week beginning April 2, 2012
We are finally beginning to see initial signs of technical weakness developing in some important stock indices.

Copyright: Randall Ashbourne - 2011-2012
I indicated last weekend: "So, for this week we have to balance our expectations. There is the implied jerkiness of the Moon in Gemini and the negativity of the Sun square Pluto aspect, both of which have to be balanced against the seasonal tendency and the need for fund managers to make themselves look good."
And we got both - especially the jerkiness, when the blatant attempt to manipulate Wall Street into new Highs suddenly turned sour. In the coming weeks and months, the long-range astrological indicators warn that Bernanke's attempts to emulate Greenspan's constant boom tinkering will result in yet another bad bust.
In the coming week - as we head towards the Libran Full Moon - Venus will move out of her favorite sign, Taurus, into Gemini and square Neptune. Mercury will turn Direct. We may get a taste of the mood shift likely to manifest mid-month when Mars changes direction and the Sun opposes Saturn.
Astrologically, the mood is slowly changing from the incredibly positive outlook of the Venus-Jupiter conjunction in Taurus, trined to Mars and Pluto, which took place in mid-March.
And, finally, we are starting to see technical backing for the mood shift in at least some important indices.
It is a precursor to what we can expect heading into June when Uranus makes the first of its exact square aspects to Pluto - and, also, into the middle of April, when Mars will resume Direct motion and the Sun lines up in opposition to Saturn.
Last week, we saw the expected attempt at end-of-quarter window dressing, kicked off on Monday when Ben Bernanke made it clear the US Federal Reserve is determined to see a lower dollar and higher stock prices.
Last week, we saw the expected attempt at end-of-quarter window dressing, kicked off on Monday when Ben Bernanke made it clear the US Federal Reserve is determined to see a lower dollar and higher stock prices.


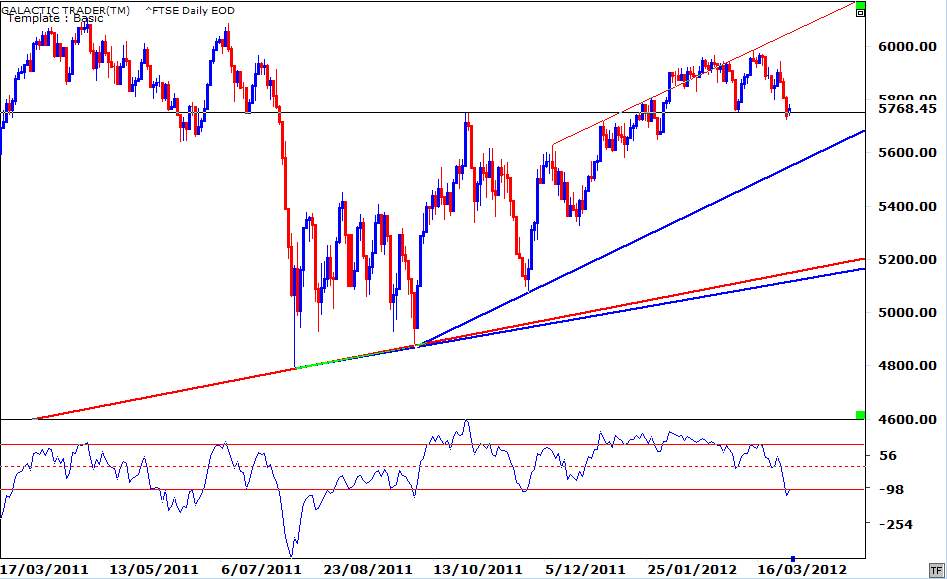
The signs are most obvious on London's FTSE index, which has not only failed to take out the 2011 Highs, but is now fighting to hold the level of the first rally out of the Lows of last year's rapid decline into August-October.
We've been waiting for some time for the technical conditions to confirm the astrological expectations. The FTSE appears to have topped out exactly with the Venus-Jupiter conjunction and has been in decline ever since ... with the long-range Canary displaying negative divergence at the price highs and warning now that further price weakness lies ahead.
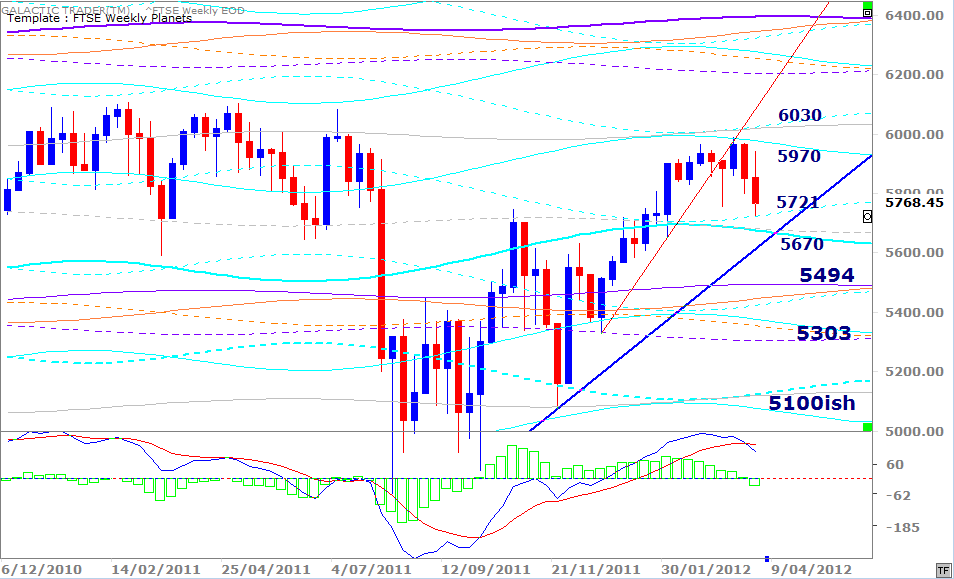
For the moment, the FTSE is getting a bounce from the "obvious" - the initial peak of the post-plunge rebound. And it's also an obvious price level on the FTSE's Weekly Planets chart (below).
For the moment, the FTSE is getting a bounce from the "obvious" - the initial peak of the post-plunge rebound. And it's also an obvious price level on the FTSE's Weekly Planets chart (below).
In fact, last week's low was a precise hit of a Saturn price line. Looking back into last year's range-trading process, we can see the index frequently found Support, especially on a Closing basis, at the dotted grey Neptune line - Support which turned into Resistance in the first climb out of the October lows and again for a couple of weeks in early January.
During that topping process last year, the FTSE bounced constantly between the dotted Neptune as Support, to above the higher grey Neptune level. So far this year, it has failed to repeat the same level of confidence and strength, failing to get back to the Neptune level and making only a single touch of the Saturn lines. And this in spite of a relatively strong performance from the MACD signal lines.
I indicated last weekend the MACD signal lines were on the verge of giving a negative crossover signal. That is now confirmed and we also have a negative bar recorded on the histogram.
Combining the technical signals from the daily chart and those from the Weekly Planets chart, we are starting to see the very first signs of panic. Now, bear with me for a moment, while I explain the astrological symbolism.
What has changed since the Grand Taurean Love Fest in mid-March is that the Sun has moved into Aries and fired up the meaning of the Uranus-Pluto square, first by conjuncting Uranus and then squaring Pluto last week.
Explaining that last weekend, I said: "Symbolically, the spotlight will be back on the sovereign debt issues in a big way." And what we got last week was exactly that - the re-emergence of the sovereign debt issues, but with the Sun's spotlight turned on the Spanish situation, rather than the Greek.
It was a taste of what is to come as we head towards June. The mild panic we saw last week will turn, increasingly, towards wild hysteria. And Bernanke will be burned every bit as badly as Greenspan was with the Tech Wreck and the housing implosion.
In the past 2 weeks, the FTSE lost what had taken 2 months to put on. We ain't seen nuttin' yet.
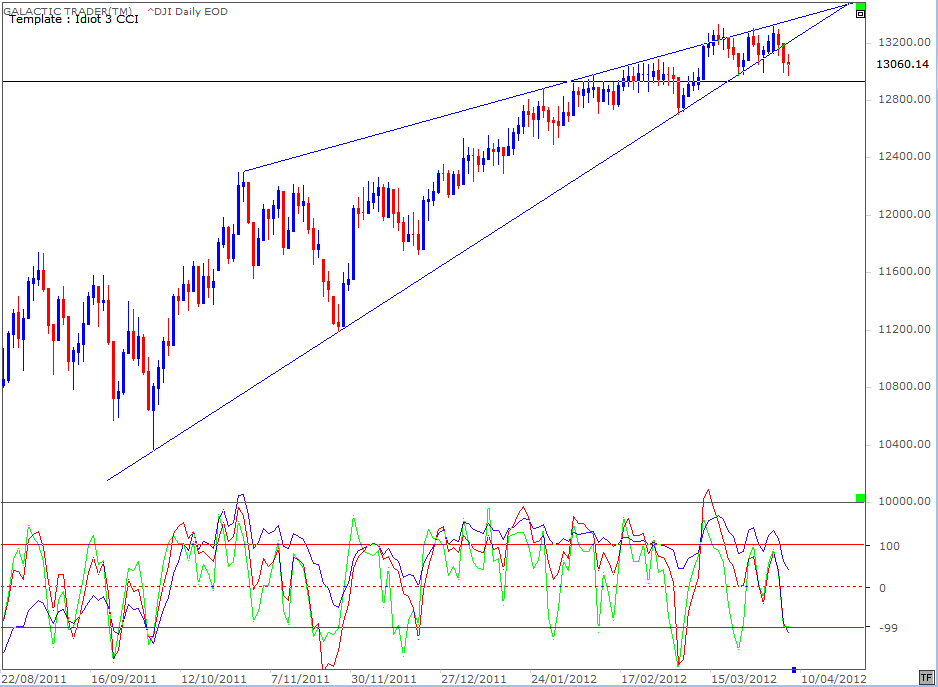
The early stages of weakness are also now starting to show up on Wall Street.
During that topping process last year, the FTSE bounced constantly between the dotted Neptune as Support, to above the higher grey Neptune level. So far this year, it has failed to repeat the same level of confidence and strength, failing to get back to the Neptune level and making only a single touch of the Saturn lines. And this in spite of a relatively strong performance from the MACD signal lines.
I indicated last weekend the MACD signal lines were on the verge of giving a negative crossover signal. That is now confirmed and we also have a negative bar recorded on the histogram.
Combining the technical signals from the daily chart and those from the Weekly Planets chart, we are starting to see the very first signs of panic. Now, bear with me for a moment, while I explain the astrological symbolism.
What has changed since the Grand Taurean Love Fest in mid-March is that the Sun has moved into Aries and fired up the meaning of the Uranus-Pluto square, first by conjuncting Uranus and then squaring Pluto last week.
Explaining that last weekend, I said: "Symbolically, the spotlight will be back on the sovereign debt issues in a big way." And what we got last week was exactly that - the re-emergence of the sovereign debt issues, but with the Sun's spotlight turned on the Spanish situation, rather than the Greek.
It was a taste of what is to come as we head towards June. The mild panic we saw last week will turn, increasingly, towards wild hysteria. And Bernanke will be burned every bit as badly as Greenspan was with the Tech Wreck and the housing implosion.
In the past 2 weeks, the FTSE lost what had taken 2 months to put on. We ain't seen nuttin' yet.
The early stages of weakness are also now starting to show up on Wall Street.
Safe trading - RA
(Disclaimer: This article is not advice or a recommendation to trade stocks; it is merely educational material.)
The chart above is the DJIA daily and for the first time we've seen a bad break of the uptrend line from last year. True, it was very quickly recovered. But, the Canaries are beginning to wobble on their perch.
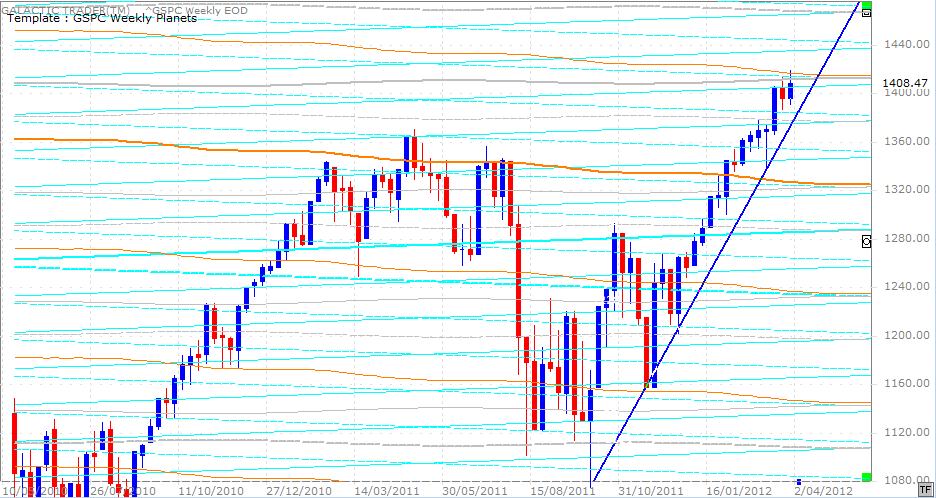
Pollyanna's Weekly Planets chart is above and shows the end-of-quarter book cooking we anticipated was likely, proved to be a real treat for all the big boys anxious to make themselves look good ... and bulk-up their bonus payments.
Can they maintain it though for another 3 months? The tight combination of Saturn, the Node and a primary Neptune line in the region just above 1411 is capping the optimism - but the key remains the SP500's ability to hold that sharp trendline. There is much Bullish talk on the US blogs at the moment about mild corrections in an ongoing Bull. And that is possible.
We do need to be aware, however, that the FTSE is already back at what would be the 1280ish level on Pollyanna - and it's not the only European or Asian index starting to develop the wobbles.
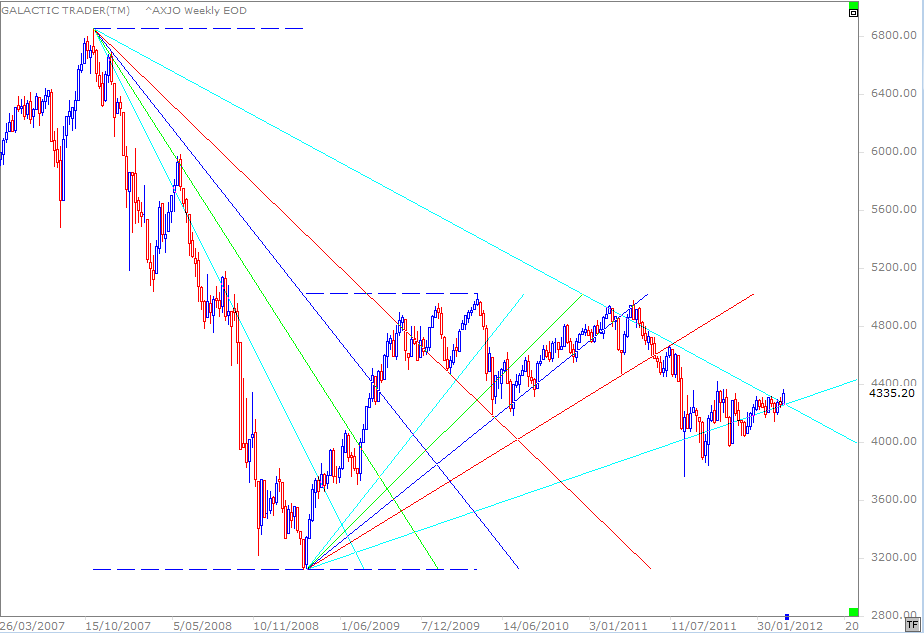
Now, interestingly, Auntie - the ASX200 - decided to breakout rather than breakdown. We've been talking about the old bat for weeks as she banged her head against the overhead Fibonacci level on the weekly chart.
We discussed how to handle it from a trading viewpoint and detailed how she was managing to hold not just Weekly Planet price levels, but her trendline ... and I also showed this chart (below) last weekend, suggesting "crunch time" for the breakout, or breakdown, was close-at-hand.
We discussed how to handle it from a trading viewpoint and detailed how she was managing to hold not just Weekly Planet price levels, but her trendline ... and I also showed this chart (below) last weekend, suggesting "crunch time" for the breakout, or breakdown, was close-at-hand.
The problem is, of course, the silly old biddy seems to have left her run a bit late. Well, that's IF I'm right about the negative outlook developing for the remainder of the year.
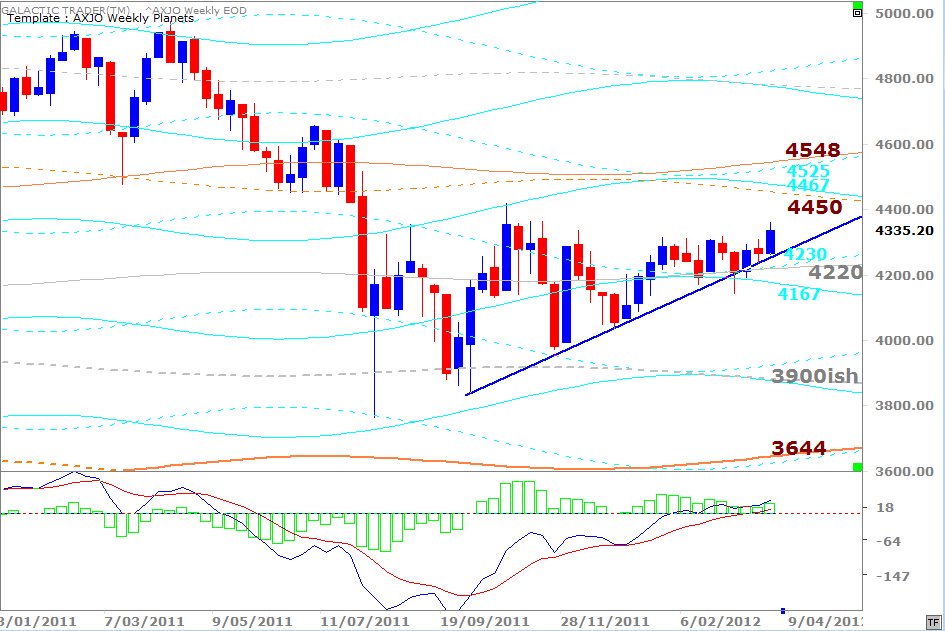
But. Yada yada, blah blah ... astrological expectations do NOT over-ride technical conditions. The charts are real. The other is ... well, it's Spooky Stuff. So, I've updated the price levels on Auntie's Weekly Planets chart to give you an indication of where she might be heading ... and the downside levels which have to hold if she's going to continue running northwards.
But. Yada yada, blah blah ... astrological expectations do NOT over-ride technical conditions. The charts are real. The other is ... well, it's Spooky Stuff. So, I've updated the price levels on Auntie's Weekly Planets chart to give you an indication of where she might be heading ... and the downside levels which have to hold if she's going to continue running northwards.