
The sign of the Bull highlighted again
Week beginning April 16, 2012
There is now a strong chance that many of the world's important stock indices have made their highs for 2012.

Copyright: Randall Ashbourne - 2011-2012
Now suspend your infidel disbeliefs and bear with me while I explain a bit of The Spooky Stuff. Tsk*tsk ... I did stress, at least twice, last weekend that the week would kick off with the Moon moving to Sagittarius and we could expect wide-range days where either the optimism or the fear would be exaggerated. We got the fear.
Okay, so here's what's coming. We're on countdown now to a New Moon in the first degree of Taurus. We know that statistically, stock indices have a tendency to rise into the New Moon phase. The thing is ... the Sun is also shifting to Taurus, the sign of the Bull.
It will regenerate the energy sparked by the Venus-Jupiter conjunction ... and the effect could last all the way into early May when the Sun itself conjuncts Jupiter. There'll be some other major astrological stuff around that time and I'll read those entrails closer to the time.
Mars is now back in direct motion, so all the "action" symbolism becomes renewed. And the main Marshun sign, Aries, is also highlighted because Mercury moves into the territory this week. Its first move will be to conjunct Uranus, so we can expect some shock/surprise news.
The Moon actually begins the week with a shift to Pisces. The "mood" will be deceptive and even a tad confused about what's happening. Just remember ... the expectation is that the energy of the Grand Toro Love Fest is likely to get its second wind.
That is what we were expecting to coincide with the Venus-Jupiter conjunction in the early degrees of Taurus in mid-March.
However, the possibility remains that The Top is not yet in, at least not in some of the major indices.
We should find out over the next couple of weeks
However, the possibility remains that The Top is not yet in, at least not in some of the major indices.
We should find out over the next couple of weeks


However, as I stressed yet again last weekend, all of that's just a bunch of Spooky Stuff and since we're all grown-ups, we prefer to take our real cues from the technical state of the charts.
Strange, though, is it not that the Old Gods still seem to know where markets should make their turns?
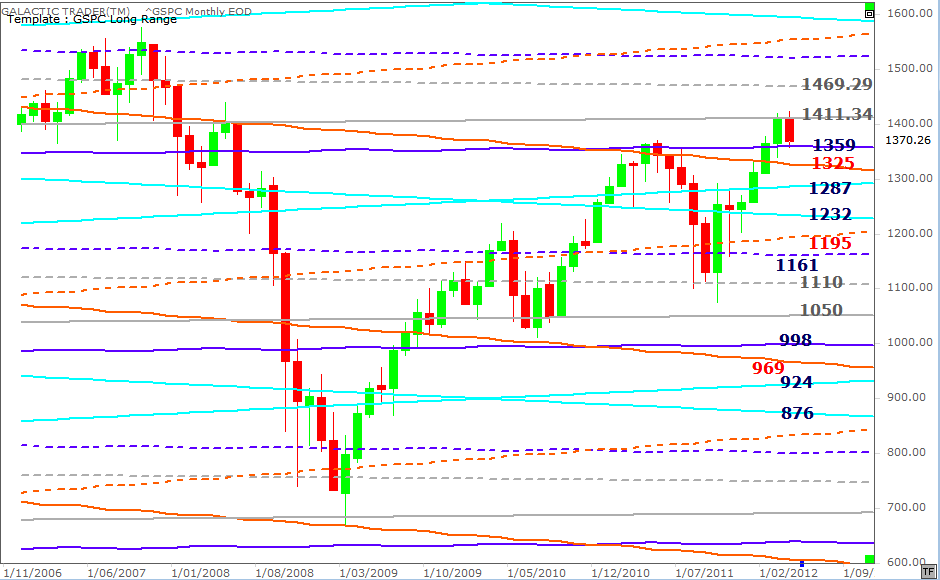
We will begin this weekend with a reminder of my Polly Long Range Old Gods chart. Yeah, yeah, I know ... I had originally expected the SP500 to top out at the 1325 or 1359 level. I was wrong.
However, the grey Neptune price line in the early 1400s is providing some formidable Resistance. Last year's plunge found Support on the Neptune line at 1110 and I really ought to have placed more weight on the chances of a Neptune-to-Neptune rebound, rather than relying overly much on the Node-Pluto lines which capped prices last year.
So, what we can see here is: Strong Resistance at the 1411 area ... Support at around 1360 from Pluto ... and further Support from the Node around 1325. And with the possibility of a breakout to 1470ish - IF the New Moon and the Sun heading to a meeting with Jupiter do fire up the optimism once again.
May comes out as a Time possibility for another reason, relating to the ASX chart. I'll get to that later. And there's that old adage about "Sell in May and go away". But, but ... let's just concentrate on what the charts are telling us this week, eh.
Safe trading - RA
(Disclaimer: This article is not advice or a recommendation to trade stocks; it is merely educational material.)
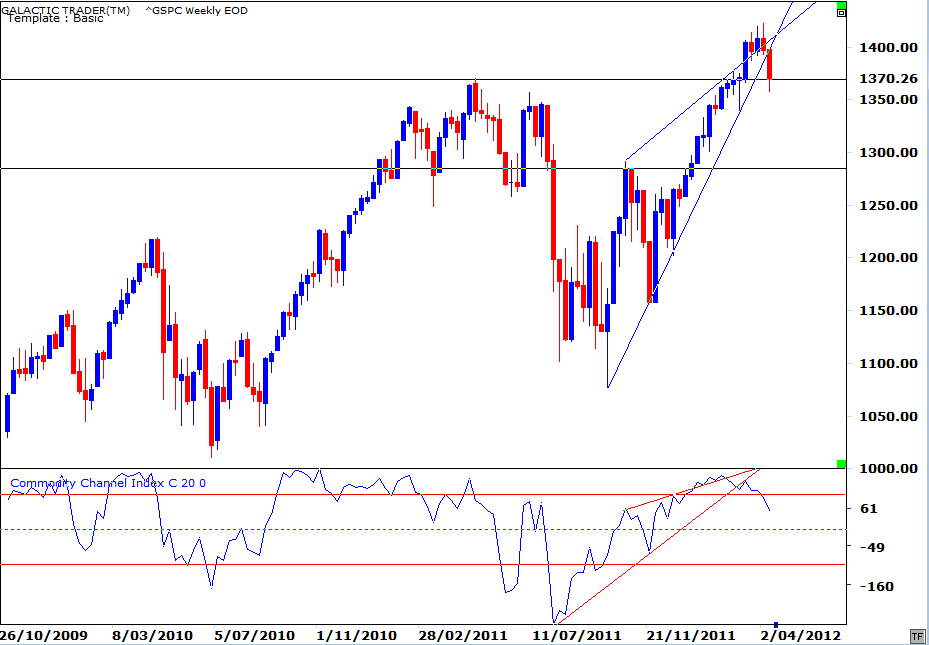
Now, when I showed this chart last weekend, I said: "The medium-range Canary on the SP500 weekly continues to deteriorate in comparison with the price and has now dropped below the +100 level, indicating some signs of a potential to follow the FTSE lower."
It's interesting the drop went down to Pluto on the long-range Old Gods chart, but recovered to close the week pretty much precisely at the level of last year's High. Nevertheless, the Canary is deteriorating ... and you know from the book that we take particular note of this oscillator when it starts to sing off-key.
It's a condition which is emphasised particularly in the FTSE, which we'll come to shortly. However, before we come to that, there's another Pollyanna chart I want to discuss.
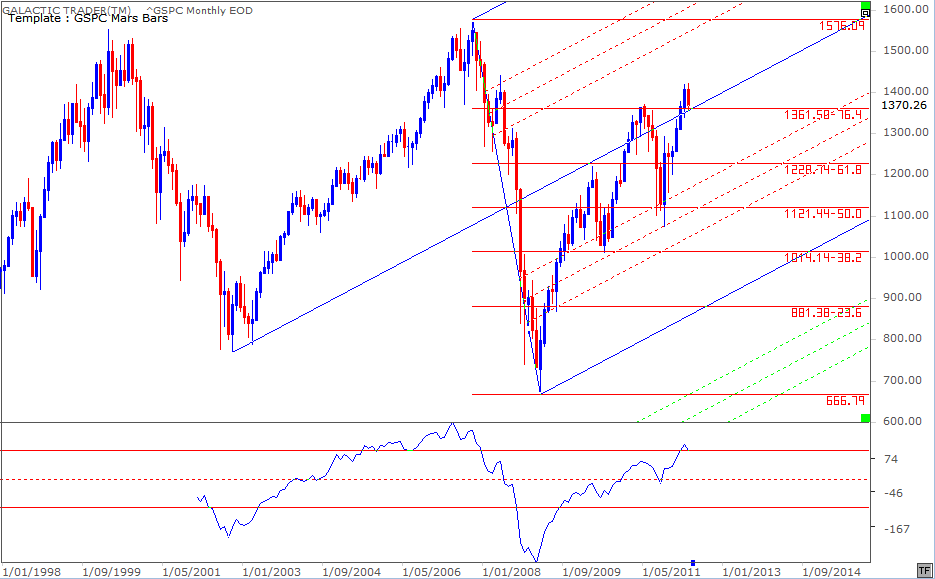
Now, this one's a monthly and I want to stress something about it because it emphasises the point I made right at the start of this weekend's edition: The possibility remains that THE Top is not yet in ... at least on the Wall Street indices.
Earlier in the year, I described this chart as "the elephant in the room". It's simple. The long-range Canary is absolutely adamant that the rally leg in Pollyanna is legitimate and real. What normally happens in these situations is that we get a higher Price High ... with a lower Canary peak - and that's the signal to get the hell out of Dodge. We don't yet have it.
This is not difficult, folks. It's explained in detail in The Technical Section ... and there is a very obvious example of how it works in real time on the weekly chart above, when the medium-range Canary started to croak while Price was trying to edge higher. To be absobloodylutely sure The Top is in, we would want to see the same condition develop with the long-range bird.
So, I repeat: My expectation from The Spooky Stuff is that there's a strong chance many important world indices have topped out and are entering the very early stages of a woeful new Bear phase ... but the technical conditions do not rule out one more rally leg before los Yanquis also fall in a hole.
Now, we'll turn our attention to the Briddish cousins to see what their charts are saying about the general state of things.
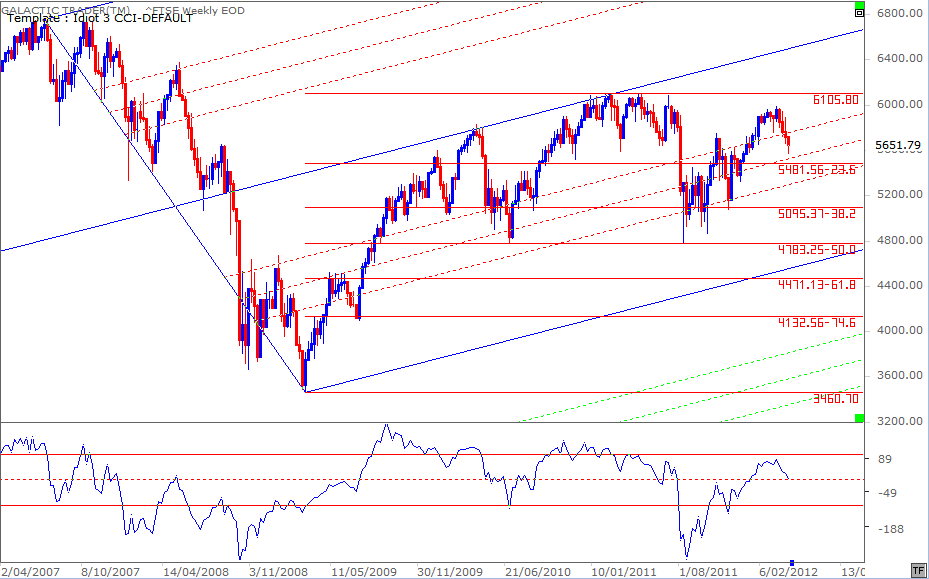
Let's start the analysis with the FTSE Weekly. Now, here again we see the importance of using the Canaries. This one is a long-range, but applied to a Weekly chart, rather than a Monthly. Make special note of the long-range deterioration in the oscillator peaks.
Hear those klaxons going off? The air has been turning ever more toxic the longer this rebound from March 2009 has gone on. And the deterioration is not just in the oscillator peaks. Last year's price dive which took the FTSE down to a potential double-bottom pattern, resulted in a significantly lower plunge in the oscillator trough - to a level not seen since late in 2008.
This index is screaming with warning signs that all is NOT well. At this stage, it's also showing the potential for a long-range head-and-shoulders pattern to become real. Now, it's true a lot of supposed H&S patterns morph into the dreaded "something else". But! If this one comes to pass - and there are signs from the oscillator that it's firming up as probable, rather than merely possible, the FTSE may already be in the very early stages of a death dive.
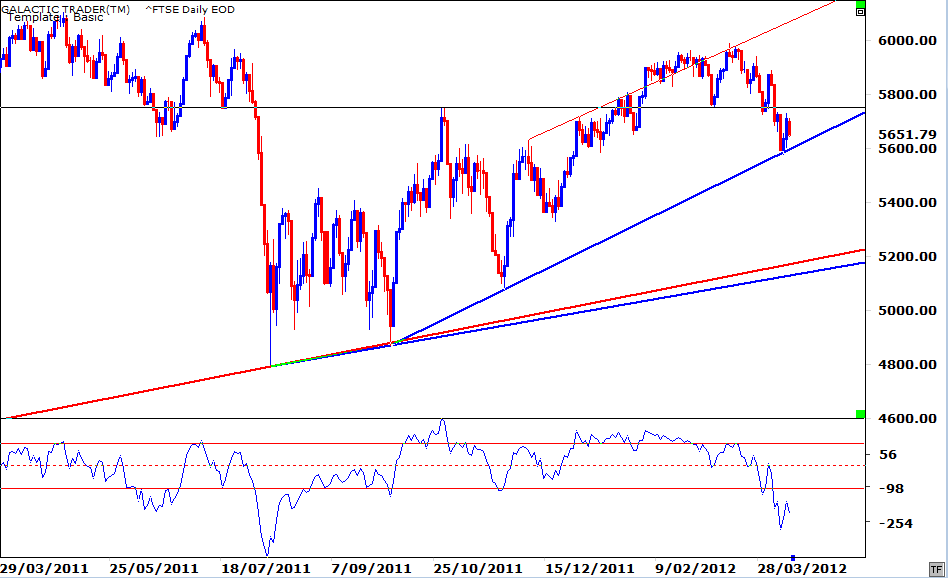
Turning our attention to the FTSE Daily, we see the bounceback has originated at yet another "obvious" level. The initial drop stopped at the obvious level of the previous High ... and last week dropped further into a touch of the shallow, intermediate trendline. Again, I stress the very deep plunge that has occurred in the oscillator trough.
I've indicated over the past couple of weekends that the FTSE was showing us a glimpse of panic - a taste of what we're likely to see develop on a much larger scale as the Uranus-Pluto square aspect hits mid-year.
In The Technical Section of the book, in the chapter on Price & Time, I detail the length of trends and countertrends. On the FTSE Weekly Planets chart above, we can see the FTSE might have completed a first degree countertrend (at a weekly level), which matches the previous largest countertrend since last August/October in terms of Time.
Now, that won't be confirmed unless the index can close the coming week at least within the Saturn range on the planet price chart.
Okay, let's turn our attention to Auntie, the ASX200, and I'll show you why I think May might be the go - independent of the Taurean revival show happening with the New Moon and the Sun's kissy-smoochy with Jupiter.
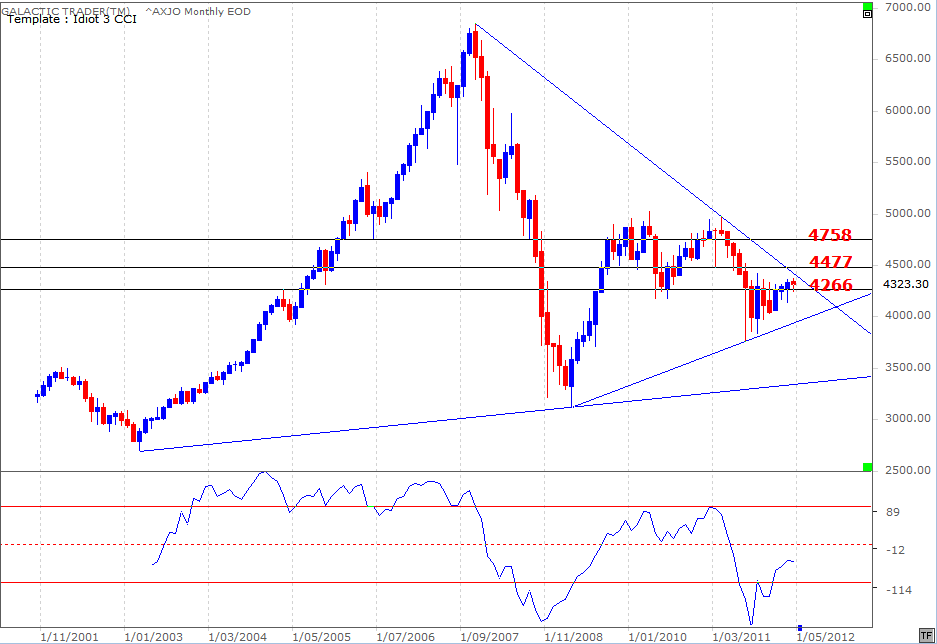
Firstly, just a really simple technical chart with some big picture trendlines and horizontal Support-Resistance levels. No explanation needed.
And now pretty much the same thing using a series of Gann angle fans. Spend a few minutes with it, okay? Either this month, or next, Auntie runs foul not just of the hand-drawn trendline in the earlier chart, but also the primary Gann downtrend angle coming down from the Bull market Highs.
It met this line last year and ran away, losing the (cyan) primary Gann uptrend angle from the 2009 Bear bottom. It plunged all the way to a Gann angle coming off the 2002 Bear bottom and recovered initially to a higher level of the same fan ... before plunging again to retest the lower angle over two months. Highs are being capped by one of the 2002 fan lines and underwritten by one of the 2009 (cyan) fan lines.
It met this line last year and ran away, losing the (cyan) primary Gann uptrend angle from the 2009 Bear bottom. It plunged all the way to a Gann angle coming off the 2002 Bear bottom and recovered initially to a higher level of the same fan ... before plunging again to retest the lower angle over two months. Highs are being capped by one of the 2002 fan lines and underwritten by one of the 2009 (cyan) fan lines.


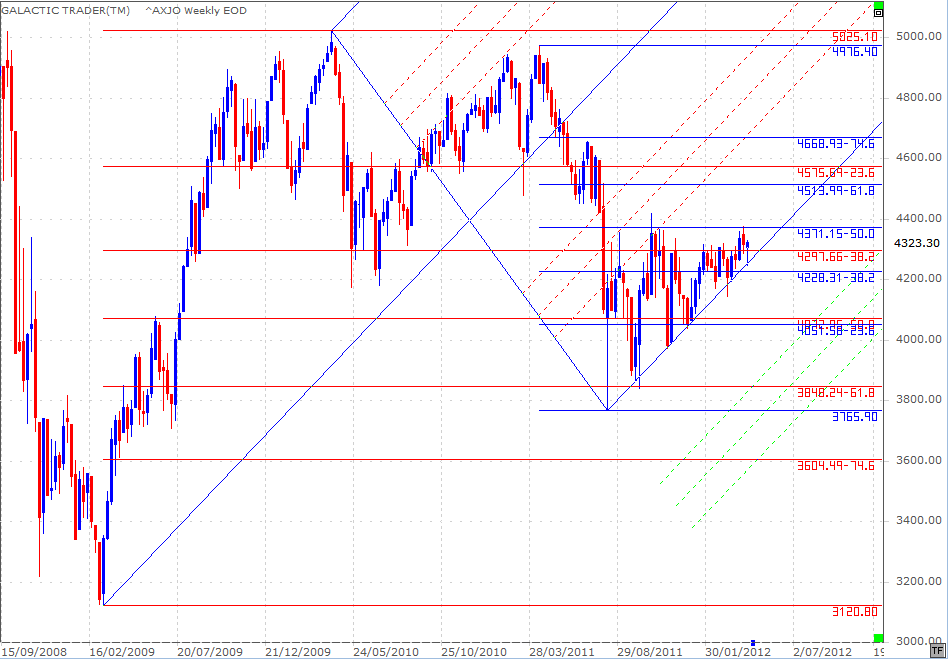
Above is a variation of the "cheat sheet" Fibonacci chart I've used several times in the past few months. For the moment, the old girl is just managing to hold the lower major tyne of a pitchfork anchored at the 2009 Low. We had another test of the bottom tyne last week - and a bounce from it.
Price continues to be squeezed between the rising pressure of the pitchfork and the horizontal levels of the Fibolin's strings.
Eventually, one of these is going to be broken. However, you can see the technical condition which endorses my very early statement this weekend about the possibility that The Top is not yet "in", in every index. Anyway, the price conditions and targets are pretty obvious from this chart, so I'll omit the Weekly Planets chart for Auntie. You can find it in the Archives from last week if you need to refresh your memory.
And I'll leave you with a reminder about the disclaimer at the bottom. These weekly reports are NOT trade recommendations; they're intended to help you actually apply some of the techniques outlined in the book - from using the Canaries and watching for their song changes, to drawing your own trendlines and horizontal levels of Support and Resistance - and using the Old Gods and Moods of The Moon to help define Entry and Exit prices and timing.
I received a letter during the week from a German reader who bought the book recently.
"Hi Randall,
I would like to thank you sincerely for your precious little book.
Although I managed to trade successfully I was under constant strain due to over-analysis. Thank you very much for lifting this ban!"
I have to confess to being somewhat chuffed, because getting that particular monkey off people's back was a major aim of The Idiot & The Moon. I would hope this weekend's edition of the Eye of Ra also stresses that point. Trading doesn't have to be hard and full of angst. Using a few good tools consistently can provide you with all the information you really need to make profits - safely, reliably and regularly.