Asian indices and headwinds for SP500
Week beginning April 12, 2015
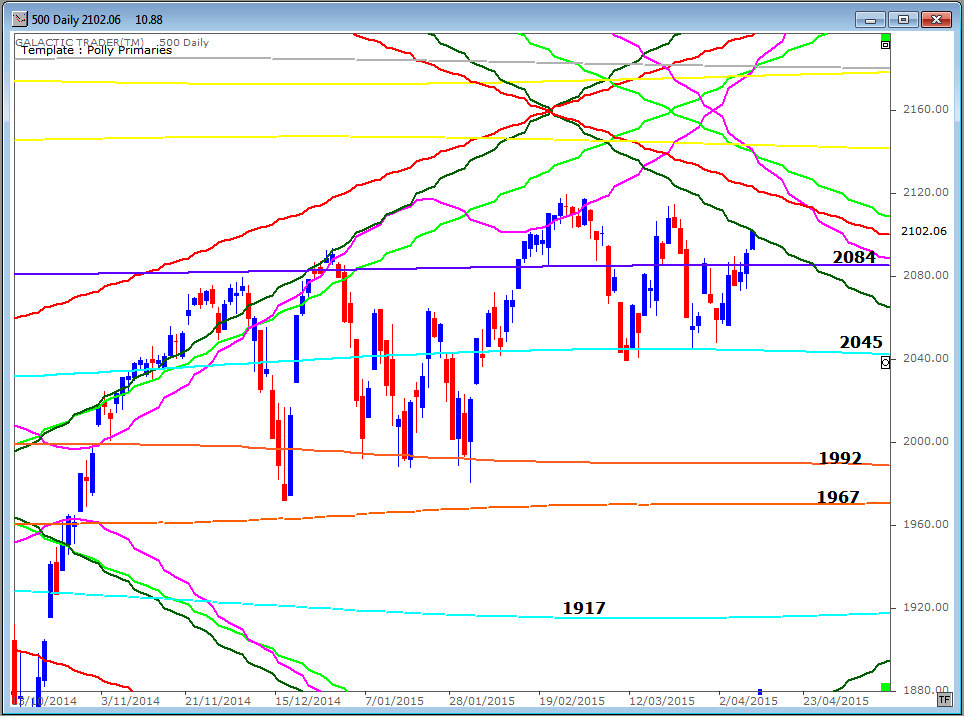
Friday's burst on Wall Street has now brought the SP500 into direct contact with planetary price lines with potential to reverse the rally.
Copyright: Randall Ashbourne - 2011-2015
Venus will oppose Saturn on Tuesday in EuroAmerica (Wednesday in Australia/Asia) and that aspect often turns a trend.
Next weekend, Mars will square Jupiter. The two aspects combined, pack a fair amount of energy. Venus deals with the material "value" of things and Saturn represents boundaries, while Mars is drive and Jupiter symbolises exaggeration.
I'll briefly update the SP500's chart this weekend and spend the remainder of the edition on long range planetary price charts for the major Indian and Chinese markets.
We took a look at this in some detail in the March 30 edition which can be accessed via the updated Archives button on the right.
It's not certain direct contact with the falling inner planet lines will provoke an immediate correction, but they are primary lines and have a strong tendency to produce downturns which last several weeks ... or worse.
It's not certain direct contact with the falling inner planet lines will provoke an immediate correction, but they are primary lines and have a strong tendency to produce downturns which last several weeks ... or worse.


Safe trading - RA
(Disclaimer: This article is not advice or a recommendation to trade stocks; it is merely educational material.)
Firstly, the 500. As I said earlier, the detail of this was in the March 30 edition and the major up and down price targets were dealt with in the Forecast at the start of the year. Both can be viewed under the Archives button.
Pollyanna's late burst on Friday brought it into hard contact with a falling Venus primary price line ... and there is a stack of other resistance she'll have to overcome in the next 20 to 30 points.
Pollyanna's late burst on Friday brought it into hard contact with a falling Venus primary price line ... and there is a stack of other resistance she'll have to overcome in the next 20 to 30 points.
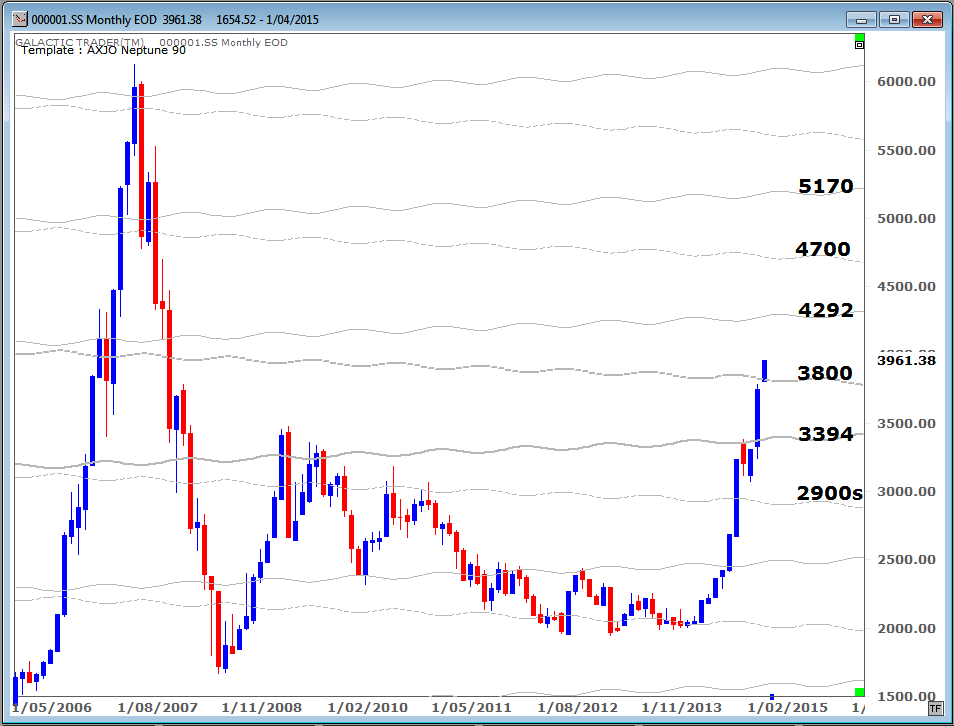
I have been promising to update the charts for the Asian indices and we'll begin with the mainland Chinese index, Shanghai. Similar to the Australian stock market, Shanghai tends to find long-range support and resistance at Neptune price lines.
The index has virtually doubled in value in the past year. The strong rally has produced some major price gaps on weekly charts, along with growing divergence from oscillators in the shorter timeframes.
The index has virtually doubled in value in the past year. The strong rally has produced some major price gaps on weekly charts, along with growing divergence from oscillators in the shorter timeframes.
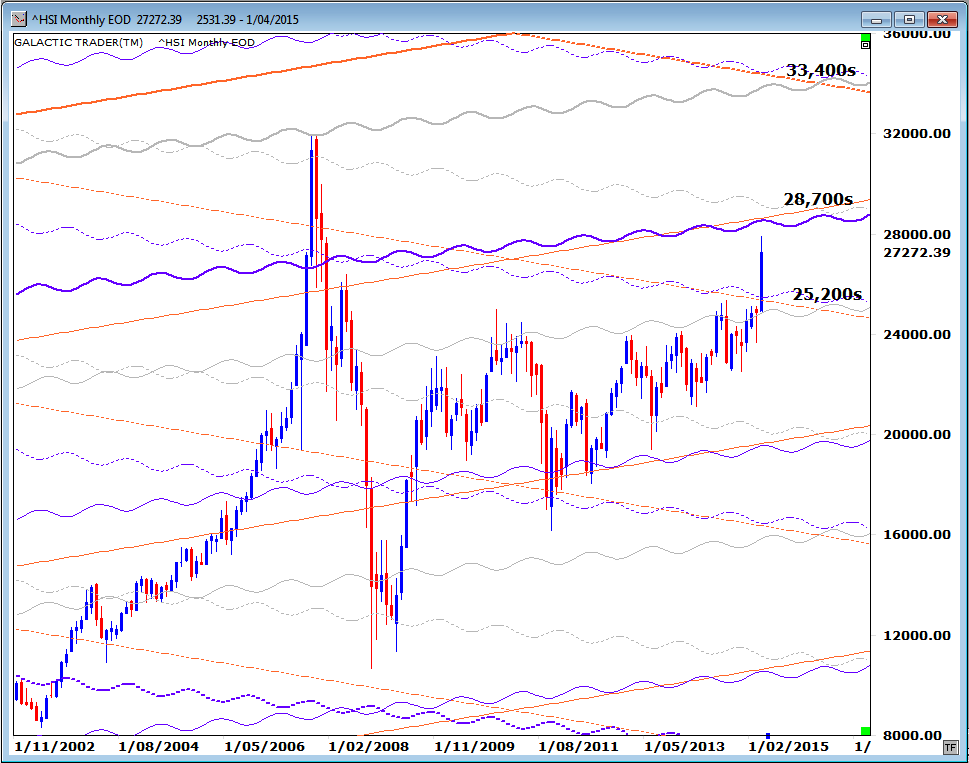
The rally on the mainland has also helped lift Hong Kong's Hang Seng Index out of a long-running trading range and it's finally heading into the next significant planetary price resistance zone
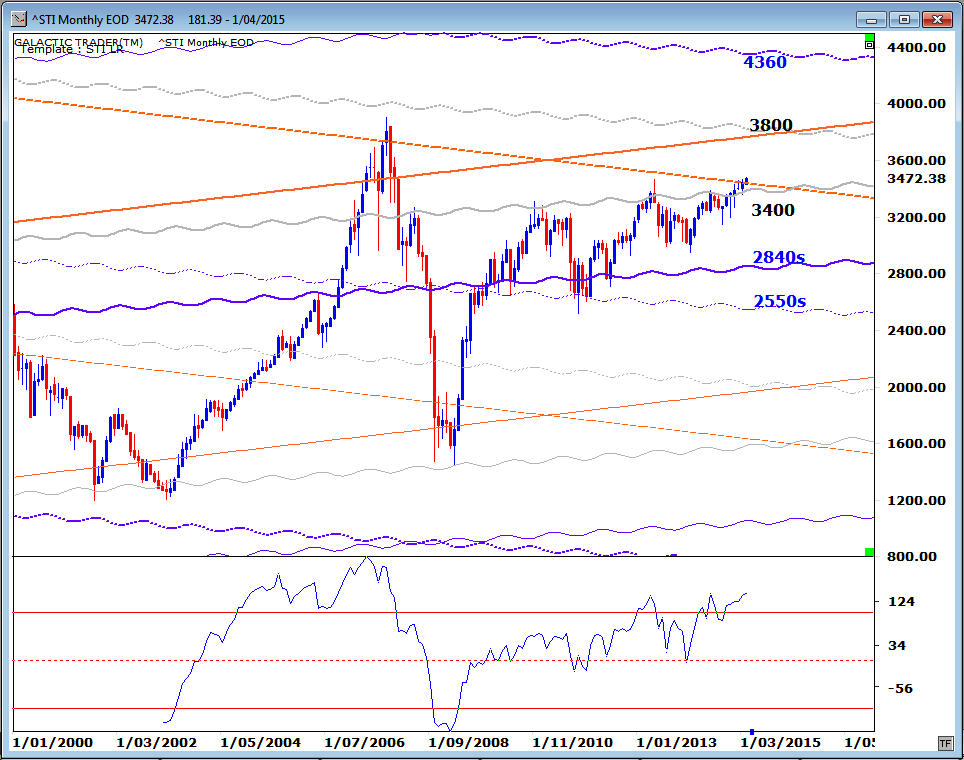
Singapore's market is now also showing potential to breakout after breaching a major Neptune barrier with a strong history. This line caused a stall going into the 2007 blow-off peak; turned into resistance again for the first corrective rally once the Bear began ... and baulked the post 2009 recovery phase three times before finally giving way in the past few months.
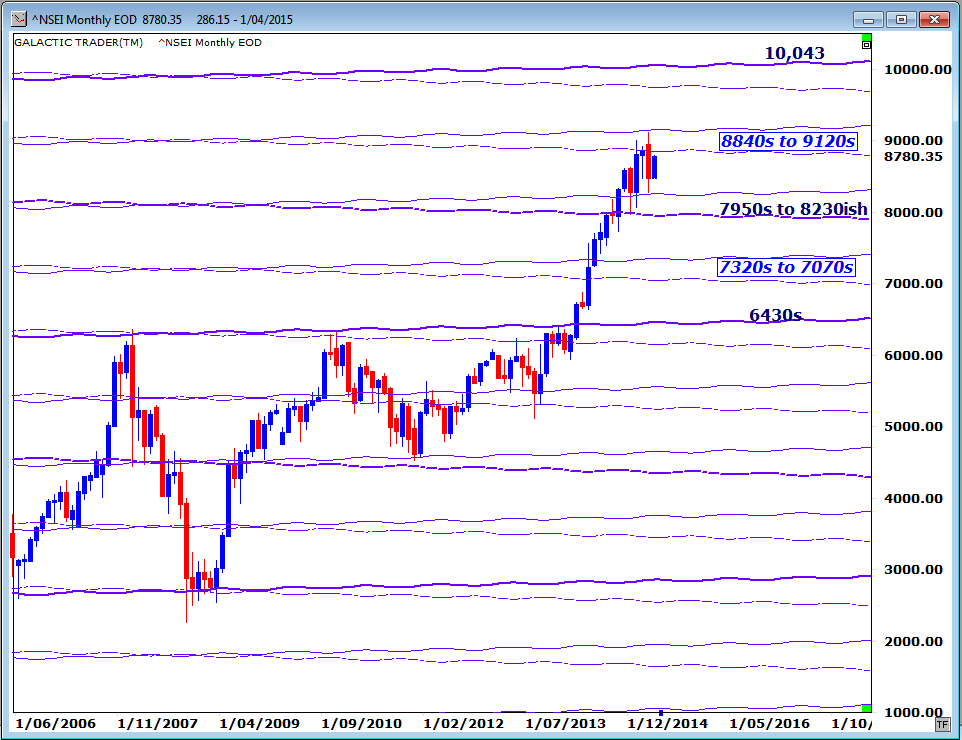
I can't remember the last time we looked in detail at India's Nifty index ... but the long-range planetary lines obviously continue to work.
The "trick", of course, as with all the indices we look at, is to use these long-range charts as target zones, but to time Entry and Exit points using daily and weekly technical charts.
The "trick", of course, as with all the indices we look at, is to use these long-range charts as target zones, but to time Entry and Exit points using daily and weekly technical charts.
I've received some requests to have another major look at gold and the gold miners. No promises, but I'll try to get that done sometime in the next few weeks.
Until then ...
Until then ...