

In stock trading, anything is always possible. Thats not the point. Spending too much time trying to ponder the possibles is the primary reason for analysis paralysis.

New Bull or Old Bear ... the big picture view
August 16, 2011
by
Randall Ashbourne
August 16, 2011
by
Randall Ashbourne

While we need to be aware of what is possible, there is much more to be gained by trying to get an objective view of what is probable.
To do that, we need to look at the evidence. Let me stress, as I do so many times in both The Idiot & The Moon and in the weekly Eye of Ra reports, the evidence is in your charts! It is NOT in the opinions of the talking heads who populate the media.
Without being unduly smart-alecky, three things are possible - markets will go up, down or sideways.
Now we will begin looking at the evidence for what is probable.
To do that, I need to begin by doing something I urge both market newbies and disillusioned oldies NOT to do - and that is to get embroiled in the complexities of Elliott Wave theory. However, I will do it in its simplest and most basic form.
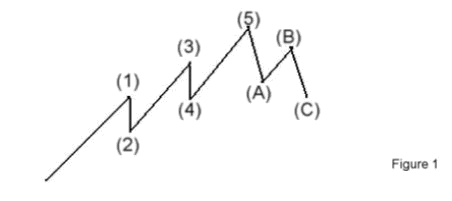
And the most simple and basic form is: Markets make 3 steps forward and 2 steps back for each completed pattern.
We are not concerned in this article about the complexities of breaking those basic waves down into their individual component legs.
In fact, it is something you must NOT try to do or you will be in dire danger of failing to grasp the big picture!
All that is necessary to understand here is that we are at one of two likely positions within the basic diagram to the left. We are either halfway through the downleg 4 ... OR, we have reached the B and have, probably, started on the C leg down.
Please take a few moments to familiarise yourself with those two probable positions. In broad terms, I'd like you to imagine that our big picture view takes in many, many decades.
In fact, the Wave 2 decline, in terms of this big picture, is probably THE Wall Street crash of the 1920s and 30s. We are assuming that after the crash, American stock markets - and the American economy - started rising in a multi-decade Wave 3, which is always the strongest part of a rally.
We are taking into account the enormous growth of the 20th Century - from growing use of personal transport, the move into aviation and even space, the explosion of consumer goods and technological marvels.
Now, the EW experts argue vehemently with each other about exactly where we are at this moment. None of which matters a damn, so long as we understand we are either halfway through Wave 4 ... or we are within the larger-scale ABC correction. Probably!
When it is OVER, stock markets are going to launch a VERY long-running Bull market!
And if we can PROTECT OUR CAPITAL during the Bear phase which has now probably renewed itself, we can survive to make ourselves very, very rich in the years to come.
Now, for the first part of this exercise, we are going to ignore the Bear probabilities and consider the alternative, possible view - whether a long-running New Bull is already underway and, in fact, began with the 2009 Low.
Possibility One: The New Bull market is already underway!
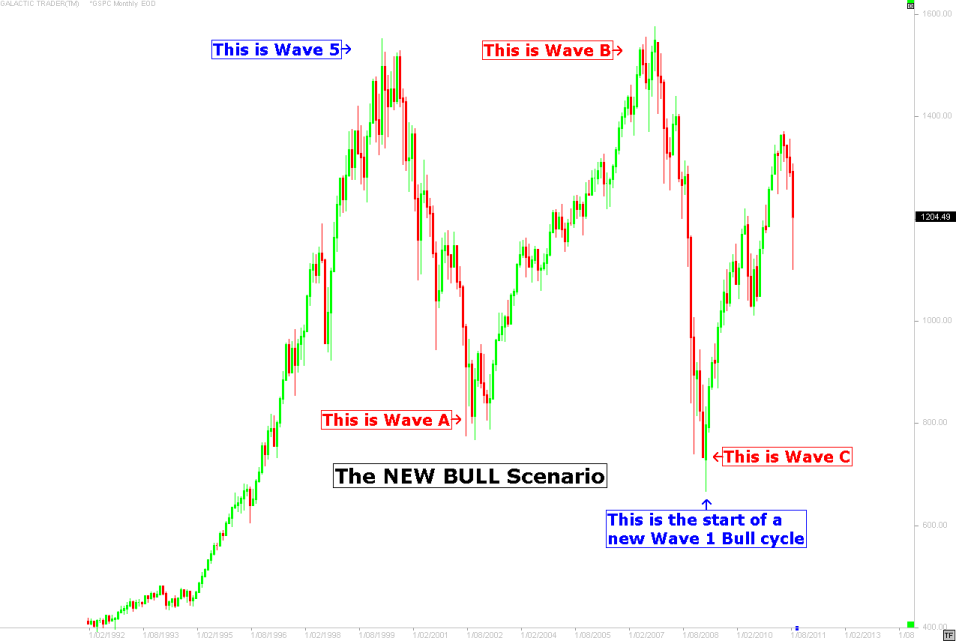
I have inserted the basic Elliott Wave structure into the left of this chart to help us keep it in mind and see the potential for the market to continue rising after the current correction is complete.
This is how many EW experts are reading the current state of the market: The "crash" finished in 2009 and it's all up, up and away for the next few decades.
Nor is this possible reading of the EW pattern the only piece of evidence in favour of this scenario being real.
This is how many EW experts are reading the current state of the market: The "crash" finished in 2009 and it's all up, up and away for the next few decades.
Nor is this possible reading of the EW pattern the only piece of evidence in favour of this scenario being real.
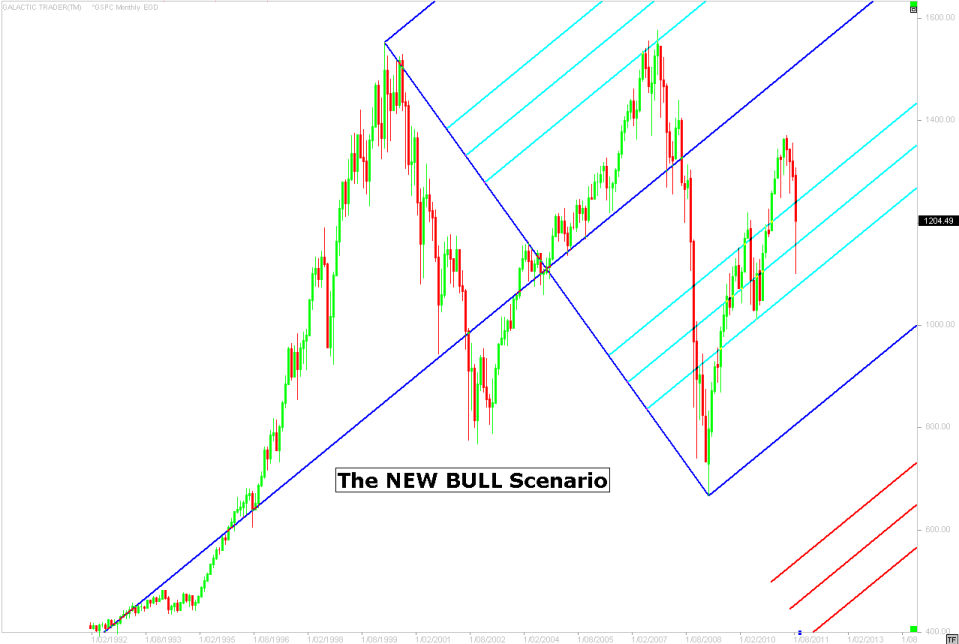
I could, for example, insert a long-range Andrew's Pitchfork on this chart and make a very clear case that the SP500 has already launched itself on a massive new Bull market and that the young Bull is only just starting to find its legs.
It is a "possible" scenario; it has a not insignificant amount of evidence that it is "real"; it is not something we should dismiss lightly, especially while Price continues to respect those Fibonacci layers within the dark blue boundaries of the primary pitchfork.
Okay, so there's the first of my smart-alecky possibilities ... markets will go up! Now, let's consider the scenario that markets will go sideways - because there's evidence for that, too!
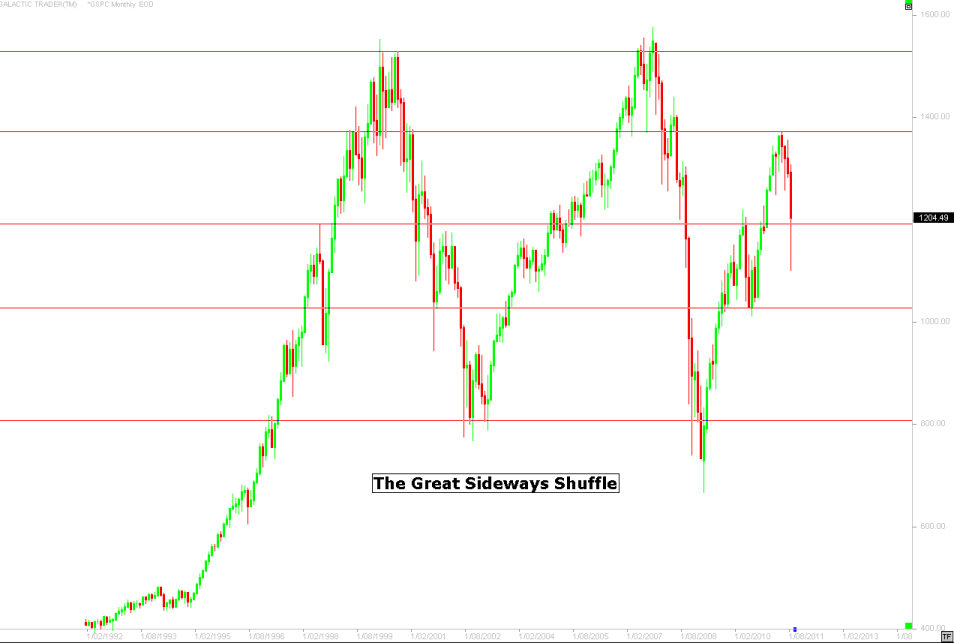
Possibility Two: the markets will go sideways
Now, come on! It's far too early in our analysis for your eyes to glaze over or your brain become befuddled. This is just a big picture, higher-level view of the stuff I talk about in the final chapter of The Technical Section.
And we've also been using some of it on a smaller-scale in The Eye of Ra to predict turning points for swing trades. It always begins with the basic premise ... a large amount of Price in a small amount of Time has to be balanced by a small amount of Price over a large period of Time.
One might say: But these aren't small amounts of Price!! That's true. But, it's relative. Bear in mind what I said in the book about the need to adjust the "level" of your thinking, depending on the Price moves and timeframes you're looking at. In this case, the index put on an absolutely massive amount of Price in a very short timeframe into the 1999/2000 top.
Without worrying about the Elliott Wave labels, this great sideways shuffle is just a very high-level pattern absorbing Time to make up for the historically huge jump in Price. It has all been exaggerated by technological, demographic and geopolitical changes ... that is, the widespread take-up of home computers and direct Internet trading by Baby Boomers interested in taking control of their retirement funds; the shift in spending emphasis by Baby Boomers away from outfitting homes and raising children; the rapid emergence of a huge middle class demographic in India, China and some other parts of Asia.
There are many reasons why markets have become more volatile - and not all of them have to do with the complex trading programs introduced by firms like Goldman Sachs, nor with the amount of easy money generated by the profligate idiocy of the US financial system.
The Idiot & The Moon demonstrates how to make profitable use of these huge, horizontal-level Price swings, employing either The Idiot itself, or The Moods of The Moon (when they're filtered by The Idiot to determine Bull or Bear phase!). And it is also why I go to some pains to emphasise the need to be aware of the whole forest before trying to determine where, within the forest, a particular short-term pathway might be leading.
So, now that we've looked at the UP and SIDEWAYS models, let's turn our attention to the nasty, nasty/awoe, alas outlook!
Possibility Three: The Bear is back!
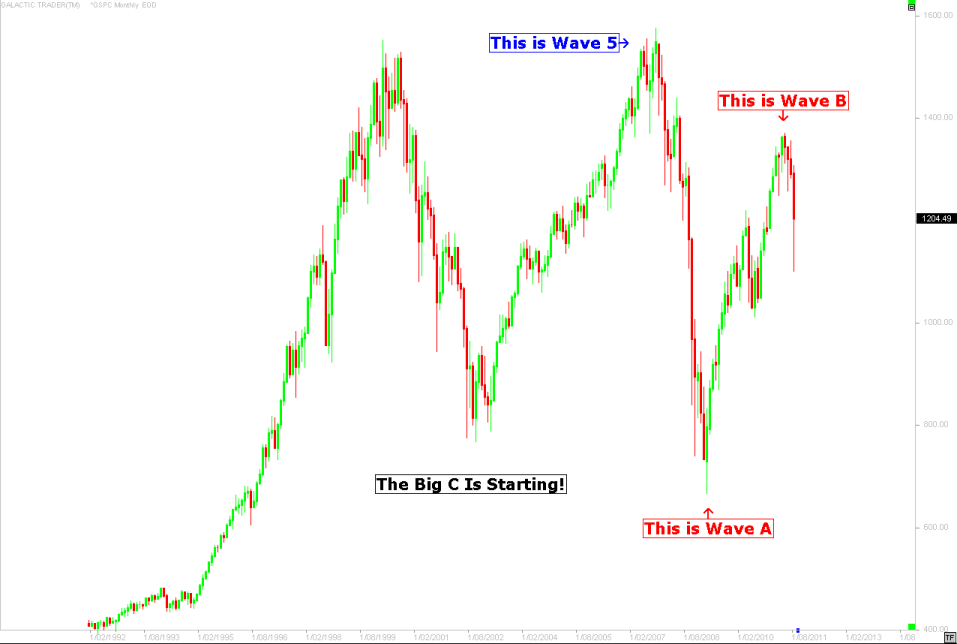
Once again, I have inserted the basic Elliott Wave stucture into the top left corner. Now, back at the beginning I indicated that we are probably halfway through the 4, or at the higher-level Wave B. The chart above allows for either scenario. Once again, adjust the "level" of your thinking.
But, far more importantly ... much, much, much more importantly ... keep in mind what happens when the correction is finished, regardless of whether it's The Really Bloody Big ABC, or just the lower-level abc pattern which makes up a Wave 4.
When this downleg is finally finished, a multi-decade Bull market starts!
And that's what we really want to know about, non? We want to know what is PROBABLY going to happen so that we can PROTECT OUR CAPITAL, or Short the market if we're adventurous. And we want to know when it is SAFE to start going Long again so we can ride the new Bull like a rodeo cowboy with superglue covering his bum.
Now, there are a number of reasons I suspect we are probably at the start of the final C leg.
Now, I suppose I could go all polemic about PIIGS in shit; launch a Tea Party tirade; belittle Bernanke; goad Goldmans; or even open the flap of the fortune teller's tent and waffle mysteriously about Jupiter in Taurus and the Cardinal Cross involving the Old Gods.
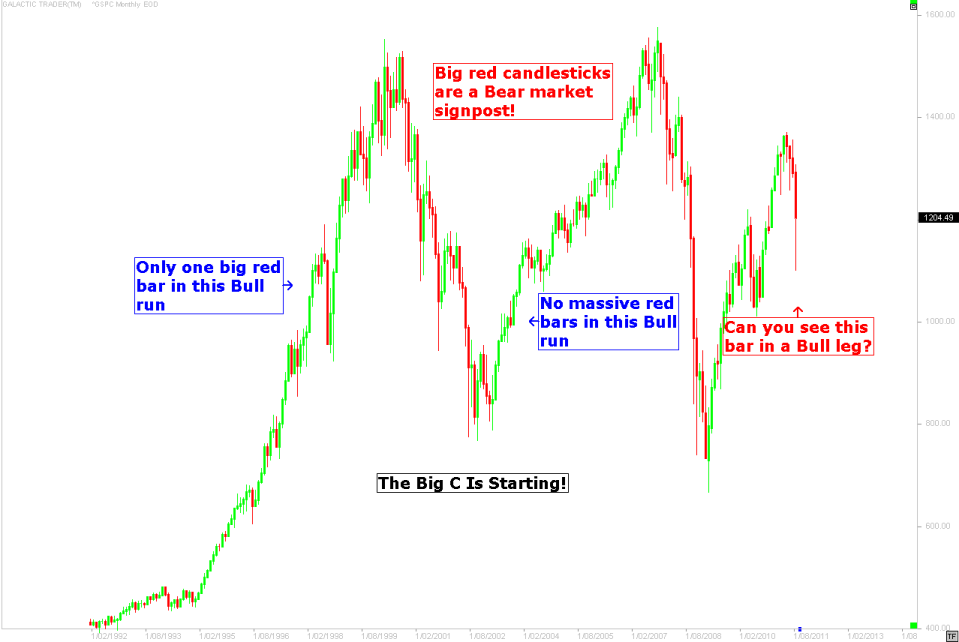
Puhleeze! Why bother?! Can you see that pattern in a Bull market?! Unless we recover and top 1370 within the next 4 months, we are in the grip of the Bear!
Okay, it's possible. We know that because we have looked at the potential quite carefully. And we know what we want to see to confirm that what is "possible" becomes the "probable". We want to see a clear turn in The Idiot across all three timeframes AND we want to hear The Canaries singing a sweet song AND we want to see the confirmation sign of a positive divergence signal on the fast MACD.
And until we do, then the "probable" is ... ALWAYS protect your capital!
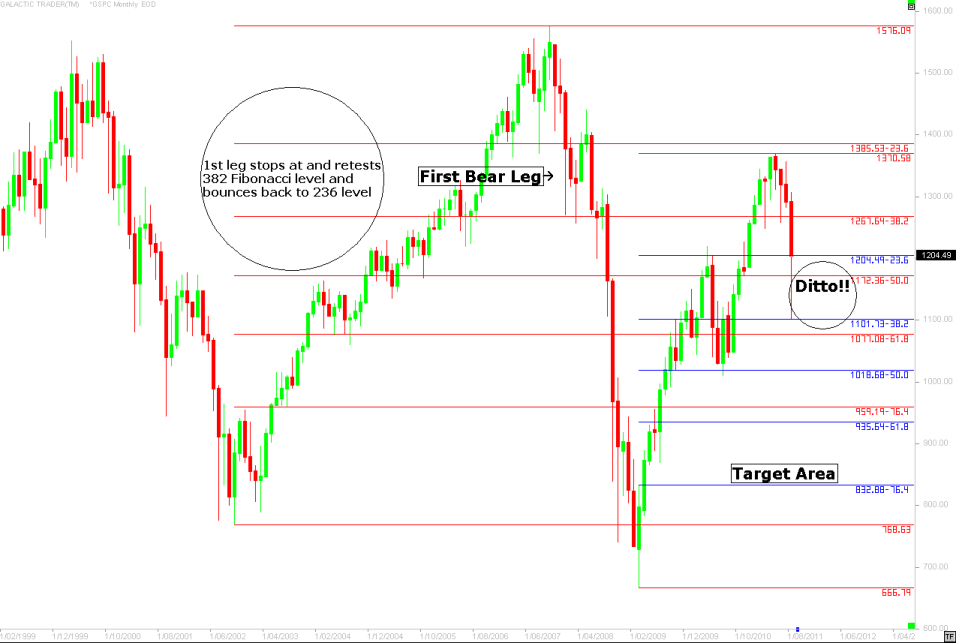
The reason we need to pay attention to the first rule of The Idiot system is because if the "normal" pattern develops for a new Bear leg after a period of consolidating the first move down, then the target levels are way below current Price levels - probably 935 to 832 for the SP500.
Puhleeze! Why bother?! Can you see that pattern in a Bull market?! Unless we recover and top 1370 within the next 4 months, we are in the grip of the Bear!
Okay, it's possible. We know that because we have looked at the potential quite carefully. And we know what we want to see to confirm that what is "possible" becomes the "probable". We want to see a clear turn in The Idiot across all three timeframes AND we want to hear The Canaries singing a sweet song AND we want to see the confirmation sign of a positive divergence signal on the fast MACD.
And until we do, then the "probable" is ... ALWAYS protect your capital!
The reason we need to pay attention to the first rule of The Idiot system is because if the "normal" pattern develops for a new Bear leg after a period of consolidating the first move down, then the target levels are way below current Price levels - probably 935 to 832 for the SP500.
Prediction is a very difficult art - even with the help of les Spookies.
However, I promised a big picture overview of what is "likely" to happen between this point and what I believe will be the final end of the Bear chapter late in 2012.
We will have to consider further information as the pattern develops to see if the markets are actually following this broad roadmap - or whether we need to revise our outlook and give higher probability to the continuing Sideways Shuffle - or even reverse course and hop back on the Bull.
Tune into The Eye of Ra each weekend for another exciting episode! You can be thrilled by riding the Mars Bar shuttle between distant planetary price lines ... chat about mystical mathematics with That Dead Italian Guy ... pit your wit against an Idiot ... or slip secretly into the tent and pay homage to Old Gods.
And hopefully, we'll make a bit of boodle ... avoid getting hit by any oncoming freight trains.
And not take it all sooooo teddibly seriously that we think Jim Cramer should seek the Republican nomination.
Copyright: Randall Ashbourne, 2011